Overview
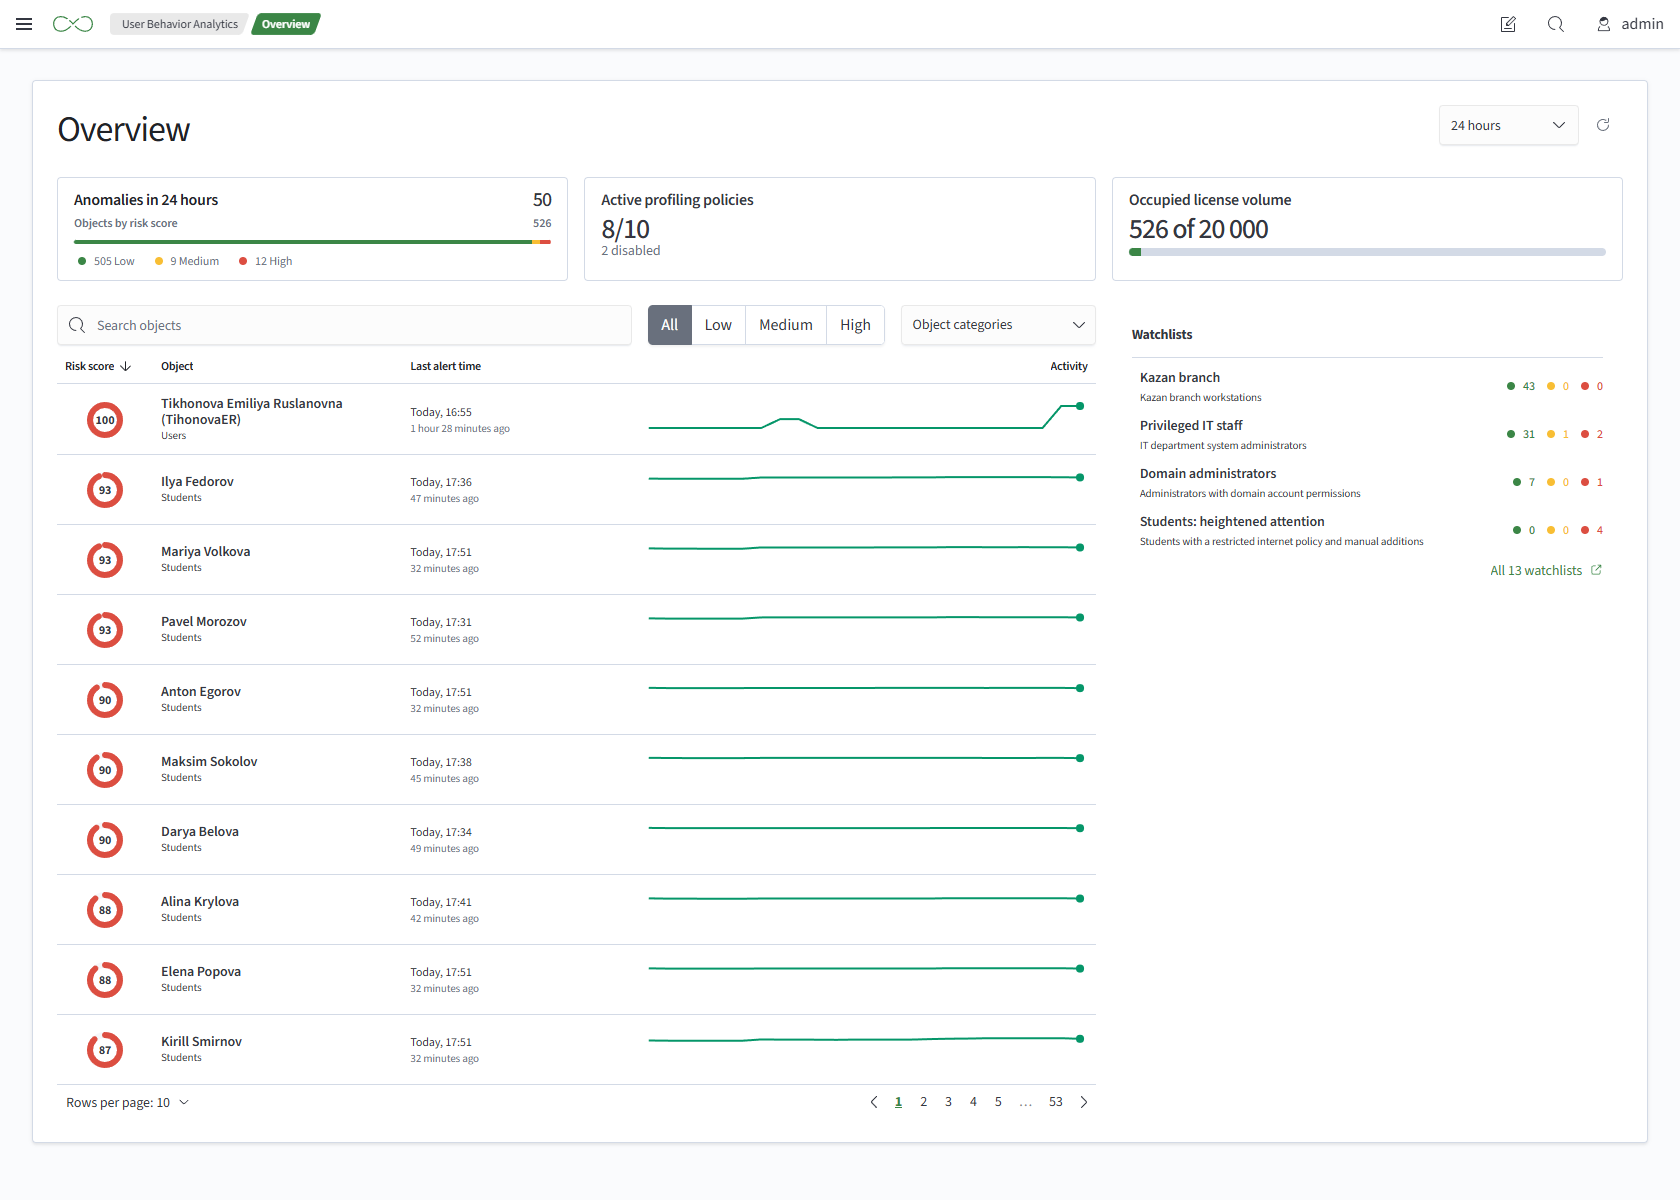
The Overview page is the module's main page. It shows the objects with the highest risk, the number of anomalies detected during the selected period, and the distribution of objects by risk level.
To open it, select Main Menu - User Behavior Analytics - Overview.
Cards
Select a period in the upper-right corner, for example 24 hours. The cards at the top of the page show:
- Anomalies during the period - the anomaly count for the selected period and the distribution of objects by risk level
- Active profiling policies - the number of active policies available to the current user and the number of disabled policies
- Used license capacity - the number of objects across all module categories and the license limit
The cards use different permission scopes: the policy count includes only policies available to the current user, while license usage covers the entire module.
Top Objects
The table lists objects with a calculated risk score. By default, rows are sorted by score in descending order.
The table contains:
- Risk score - the object's score from 0 to 100, with a color corresponding to its zone
- Object - the object name and category
- Last alert time - the time of the last alert and the time elapsed since then. The value is empty if there are no alerts
- Summary - a line showing the object's score over the period
Controls above the table include:
- an object search box
- a risk-level filter:
All,Low,Medium,High - the
Object Categoriesfilter
You can sort by score or object in either direction.
Categories for which the current user has no permissions do not appear in the filter.
Watchlists
The panel shows each watchlist connected to UBA: the number of UBA objects in the list and their distribution by risk level. Lists are sorted by object count in descending order. Selecting a list opens it on the Watchlists page.
The summary reflects membership at the time of the last score calculation. A disconnected list disappears from the panel after the next calculation.