Why This Score
The Why This Score page shows how the object risk score was calculated: which rules contributed points, how many alerts each rule has, how contributions are distributed among rule families, and how watchlists affected the result.
To open the page, click the question-mark icon to the right of the object name in the object card.
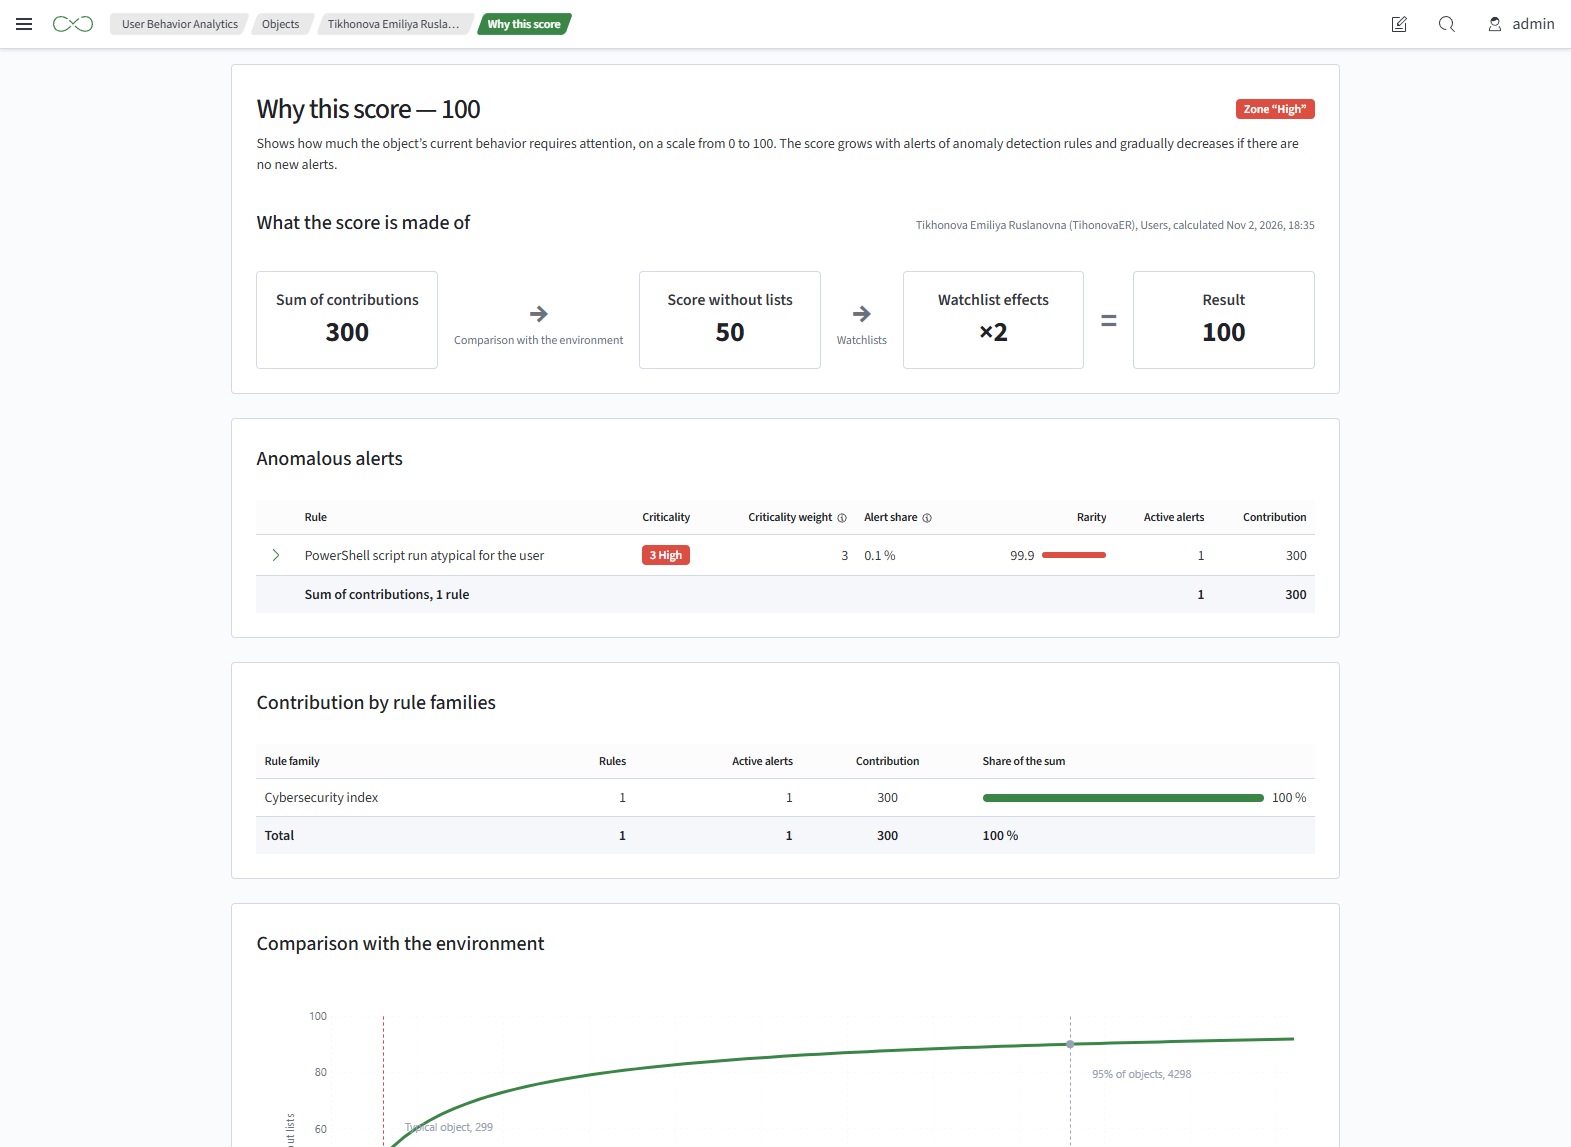
Score Breakdown
The Score Breakdown section shows the calculation flow:
sum of contributions → comparison with peers → score before lists → list effects → final score
- Sum of Contributions - contributions from all rules for the object
- Score Before Lists - the sum of contributions compared with other objects
- List Effects - the applied multiplier and additions
- Final Score - the recorded score and zone
- Calculation Time - when the score was last calculated
Calculation formulas:
final score = score before lists × multiplier + additions
rule contribution = rarity × severity weight × repeat adjustment
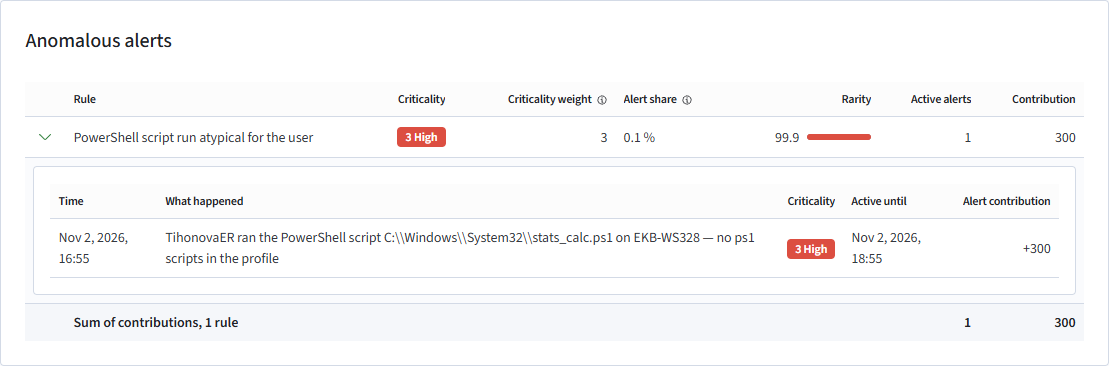
Anomalous Alerts
The table contains rules with active alerts for the object:
- Rule - its name and family
- Severity - the highest severity among its active alerts
- Severity Weight - the weight from the scoring model. A category can have its own weight
- Alert Share - the rule's share among active alerts for all objects
- Rarity - from 0 to 100: the smaller the rule's alert share, the higher its rarity
- Active Alerts - the number of the rule's active alerts for this object
- Contribution - the rule's contribution to the sum
The rarer a rule is among peer objects and the higher its severity weight, the greater its contribution. Each subsequent alert for the rule adds less than the previous one.
Expand a rule's alerts with the arrow at the start of its row. Alerts are paginated in groups of 20, newest first. Each alert shows its time, description, severity, Active Until time, and contribution. The first alert contributes the full amount; repeated alerts contribute less.
Contributions by Rule Family
This table groups the same contributions by family: rule count, active alert count, contribution, and share of the sum. Rules without a family appear in the No Family row.
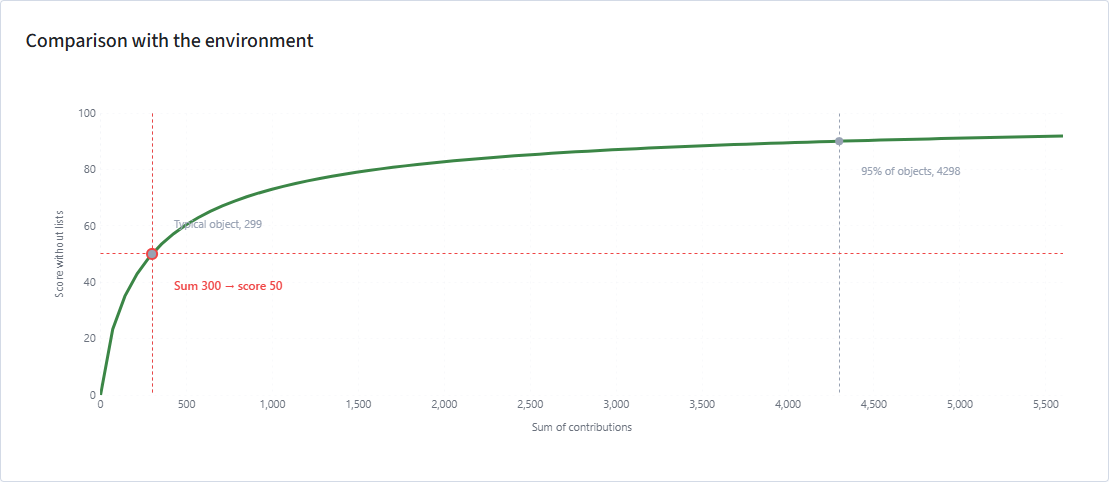
Comparison with Peers
The chart shows how the sum of contributions maps to a score from 0 to 100 and where the object stands among other objects with alerts. Points on the chart are labeled Typical Object and 95% of Objects.
The chart matches the calculation used for the recorded score: the scale is recalculated each time the score is calculated. If peer objects have not yet provided enough data for calibration, the chart is hidden and only rule contributions are shown.
A score from 0 to 100 shows how much an object stands out among other objects with alerts: a typical object scores about 50, while objects with the most serious alerts score about 90 or higher. An object's score may therefore change without new alerts for that object, because of alerts for other objects.
Watchlist Effects
The section shows the effects of the watchlists to which the object belonged when the score was calculated:
- applied multiplier - the highest multiplier among the object's watchlists
- unapplied multiplier - with a reason, for example
not applied: the Privileged watchlist has a higher ×1.5 multiplier - applied addition - points added to the final score after multiplication