Anomaly Investigation
The Anomaly Investigation tab of the object card shows the object's anomalies for a period. It lets you examine which rules triggered, in what order, and how they increased the anomaly score. For the definition of an anomaly, see Anomalies.
To open the tab, select Anomaly Investigation in the object card, or click Investigate Case in an anomaly card in the anomaly feed.
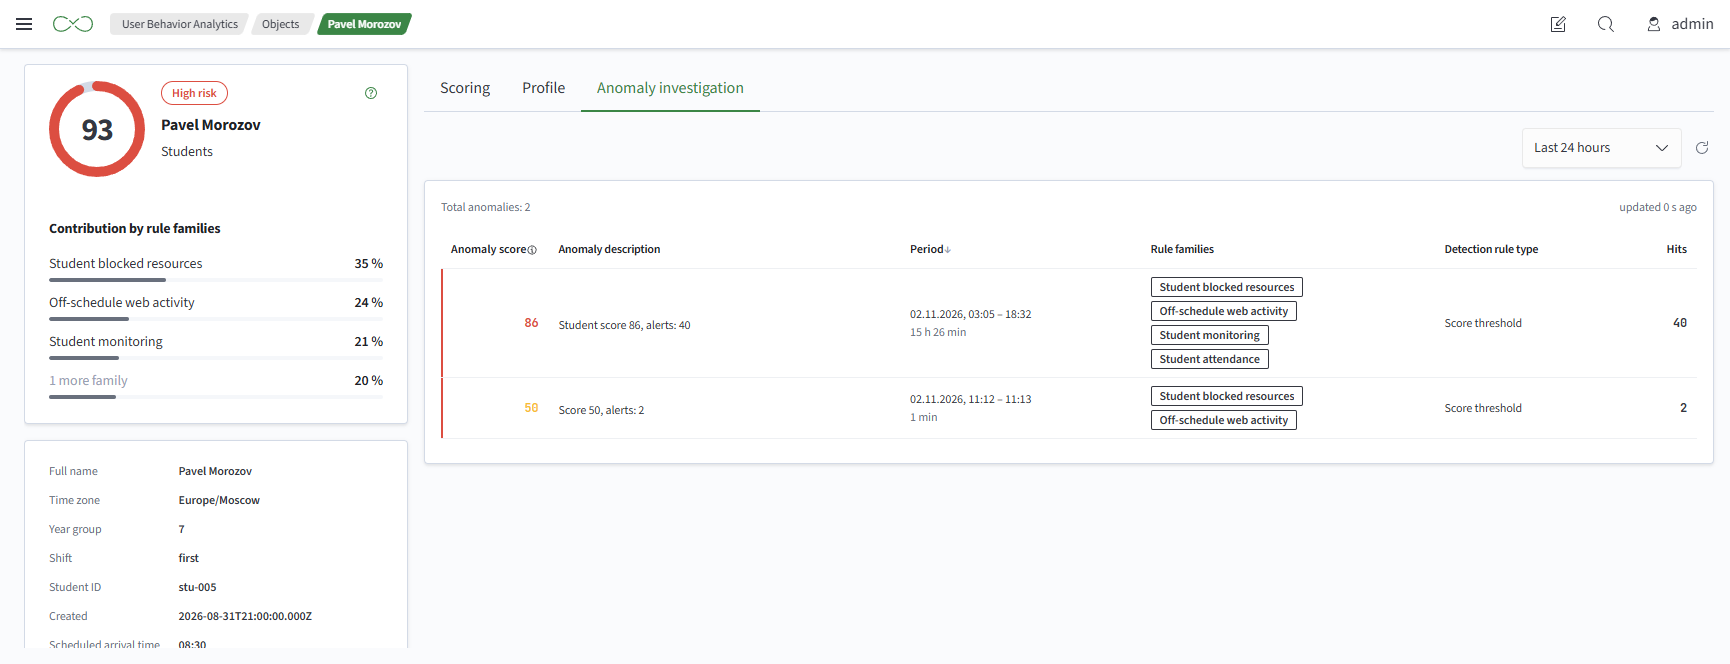
Object Anomaly Feed
The total anomaly count and last refresh time appear above the table. The table contains:
- Score - anomaly score, colored by zone
- Anomaly Description - detection rule text with substituted values
- Period - the time from the first to the last alert and its duration
- Rule Families - families of the triggered rules
- Detection Rule Type - the rule type
- Processed By - the author and time of the
Processedmark; a dash for an unprocessed anomaly. If there are no processed anomalies in the feed, this column is hidden - Alerts - the alert count
You can sort the rows by column. A new anomaly has a red bar on the left. For a reopened anomaly, the reopening count appears next to the score.
The anomaly score can differ from the object score. The anomaly score uses only the alerts in its own window and excludes watchlist effects; the object score uses all active alerts.
Anomaly Details
Click a row to expand an anomaly:
- Anomaly Summary - its period, duration, alert count, and score. A reopened anomaly also shows the number of alerts since it was last processed, for example
+10 alerts since last processed - Case History - anomaly events in chronological order
- Anomaly Rules - a brief overview of the rules
- Anomaly Timeline - how alerts increased the anomaly score
- Anomaly Alerts - all alerts in chronological order, paginated
- Processed - marks the anomaly as processed

The case history lists events from newest to oldest:
- anomaly created - the time of the anomaly's first alert
- processed - the time and author of the mark
- reopened - the time and number of alerts received after the mark
Anomaly Timeline
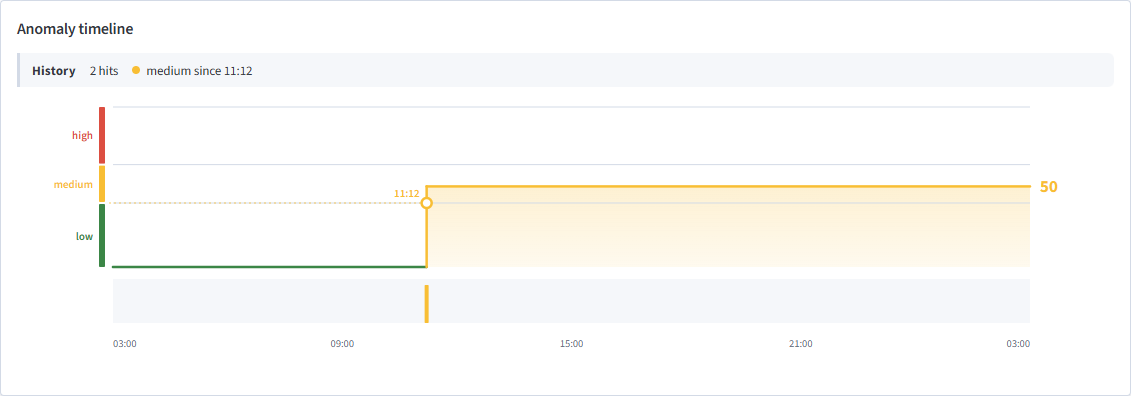
The timeline shows how the anomaly score grew over time:
- score line - steps at alert times; the line color matches the zone. The final score appears on the right
- zone scale -
low,medium, andhighon the left, based on the category's zone thresholds - zone transition - a point on the line with the time when the score entered a higher zone
- alerts - marks below the chart at alert times; the height of a mark reflects the alert count
Above the chart, the selected step shows its time interval, score before and after the increase, for example 75 → 82 +7, alert count, and rules with their alert counts.
Click a step, zone, or selected segment to narrow the alert list to that time interval. To clear the selection, click Reset, double-click, or press Esc.
Alert
An alert row shows severity color, time, violation text, and rule family. Expand the arrow on the left to see:
- Algorithm - the algorithm type and a link to the profiling policy algorithm whose result produced the alert
- Run Time - the time of the policy run whose result the rule used
- Alert Fields - fields written to the alert by the rule
- Details - a search or link, if configured in the rule
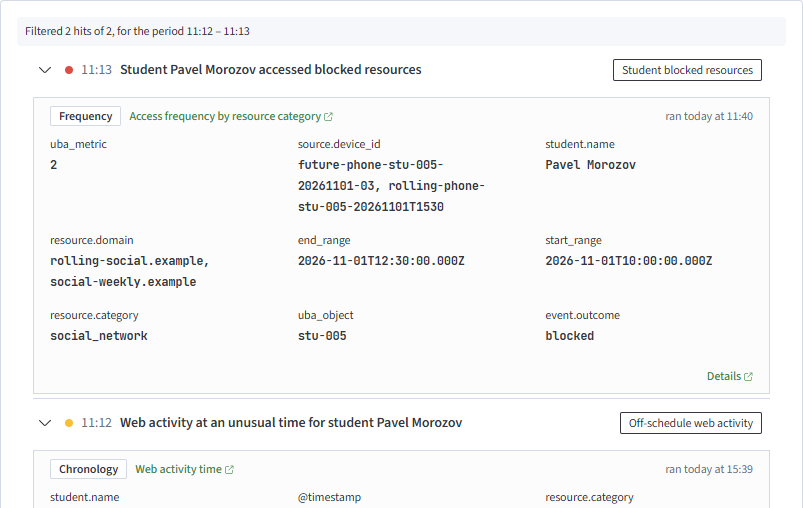
A rule created manually in Job Scheduler has no algorithm or run time.