Zabbix: Installation and Configuration Setup
General Description
The make_zabbix.py utility is used to deploy infrastructure objects for the Zabbix module. It is included in the zabbix_ko_maker package and located in the bin directory.
Utility Purpose
- deployment of basic
Smart Monitorentities required for the module to function - creation of index templates
- creation of index patterns
- inventory settings
Requirements
- Python 3.12 or higher
- utility dependencies are installed by the
bin/install_dependencies.shscript, which creates.venvand installs thesmpyandhttpxlibraries - access to the
Smart Monitorcluster with administrator privileges
Project Structure
./
├── bin/                   # Installation and deployment scripts
├── core/                  # Resource Service Model (RSM) layers
├── data/                  # Configuration files
│   ├── index_templates/   # Index templates
│   ├── index-patterns/    # Index patterns
│   ├── sm_*/              # Smart Monitor entities
│   └── inv/               # Inventory settings
├── lookup_csv/            # List of rules for incident creation
├── templates/             # RSM metric templates
├── update_zabbix_rsm/     # Script for automatic RSM service updates
└── macroses.json          # Installation macros
Configuration File Formats
Smart Monitor Entities (sm_*)
{
  "_meta": {
	  // metadata
  },
  // configuration
}
Index Templates (index_templates)
{
  "name": "zabbix_hosts_template",
  "index_template": {
    // template configuration
  }
}
RSM Layers (core/rsm/layers)
{
  "title": "Zabbix: metrics",
  "description": "layer description"
}
Index Patterns (index-patterns)
{
  "attributes": {
    "title": "zabbix_hosts-*"
  },
  "references": []
}
Inventory (inv)
inv/inventories— asset configurationsinv/relationSettings— relationships between assets
Installation Sequence
Step 1. Smart Monitor Data Collector Integration
Before starting the installation, make sure that Zabbix integration with Smart Monitor Data Collector is completed.
At this stage, all necessary pipelines should be configured, and the ZABBIX_API_TOKEN API token and logstash user password should be added to the keystore.
Step 2. Install Utility Dependencies
./bin/install_dependencies.sh
The script creates the .venv virtual environment and installs utility dependencies, including the smpy and httpx libraries.
Step 3. Run Configuration Installation
./bin/make_zabbix.py \
  --sm_host <SMART_MONITOR_HOST> \
  --sm_api_port <SMART_MONITOR_API_PORT> \
  --sm_cluster_port <OPENSEARCH_PORT> \
  --sm_user <SMART_MONITOR_USER> \
  --sm_password '<SMART_MONITOR_PASSWORD>'
| Parameter | Required | Type | Default | Description |
|---|---|---|---|---|
--sm_host | Yes | string | — | Smart Monitor cluster host |
--sm_api_port | No | int | 5601 | Frontend API port (saved objects, RSM, inventory) |
--sm_cluster_port | No | int | 9200 | OpenSearch API port (index templates, sm_* objects) |
--sm_user | Yes | string | — | Username |
--sm_password | Yes | string | — | User password |
Example:
./bin/make_zabbix.py --sm_host sm-host.my_company.ru --sm_api_port 5601 --sm_cluster_port 9200 --sm_user admin --sm_password securepassword
--sm_api_port is used for the frontend API, saved objects, RSM, and inventory. --sm_cluster_port is used for the OpenSearch API (index templates and sm_* objects).
If the frontend API and OpenSearch are published on different servers, you can explicitly set --sm_api_host and --sm_cluster_host.
Step 4. Start the Logstash Service
After successful configuration deployment, start the Logstash service:
sudo systemctl start logstash && sudo systemctl status logstash
or, if the service is already running:
sudo systemctl restart logstash && sudo systemctl status logstash
Step 5. Check the Result in the Interface
After launching, check that the settings have been applied:
-
Index Templates
- In the
Templatessection: (Main Menu-System Settings-Index Management-Templates)
- In the
-
Index Patterns
- In the
Index Patternssection: (Main Menu-System Settings-Module Settings-OPENSEARCH-Index Patterns)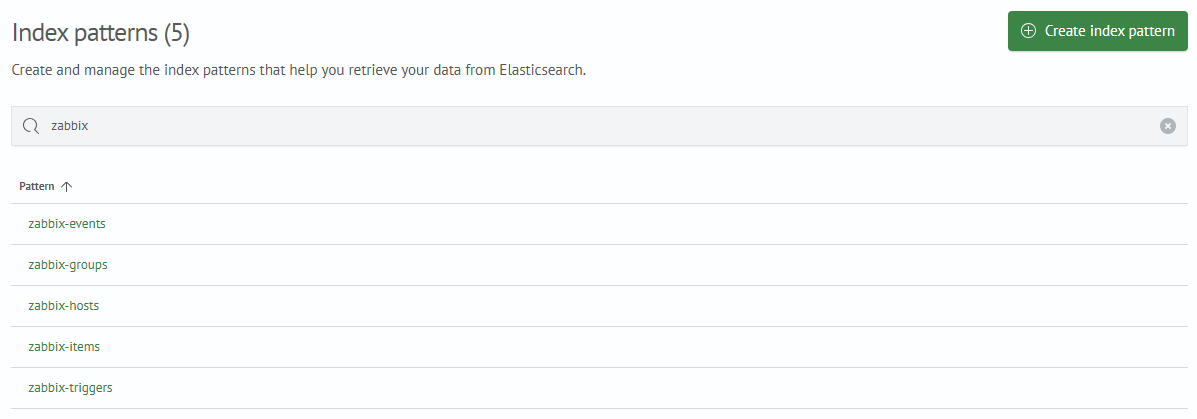
- In the
-
Lookups
- In the
Lookup Listsection: (Main Menu-Lookup Manager-Lookup List)
- In the
Step 6. Register the Module Incident Type
After importing the Zabbix content module, run the apply_incident_types.py script from the same zabbix_ko_maker utility. The script registers incident card fields (investigation playbook), idempotently creates the IT Incident incident type, and then assigns it to the module jobs.
./bin/apply_incident_types.py \
  --sm_host <SMART_MONITOR_HOST> \
  --sm_api_port <SMART_MONITOR_API_PORT> \
  --sm_user <SMART_MONITOR_USER> \
  --sm_password '<SMART_MONITOR_PASSWORD>'
After execution, verify that:
- the
IT Incidentincident type appears inMain Menu-Incident Manager-Incident Types - the type is available in the
Incident Typedropdown list in the job editor - incident jobs of the
Zabbixmodule received this type - the incident card displays the playbook fields