Database Observability: Queries
The Database Observability: Queries dashboard identifies queries with high cumulative cost, regressions in execution time, errors, and high WAL volume.
Who it is for: database administrators, application developers, and performance specialists.
Data sources: db_statements*, db_activity*, db_logs*.
Main Sections
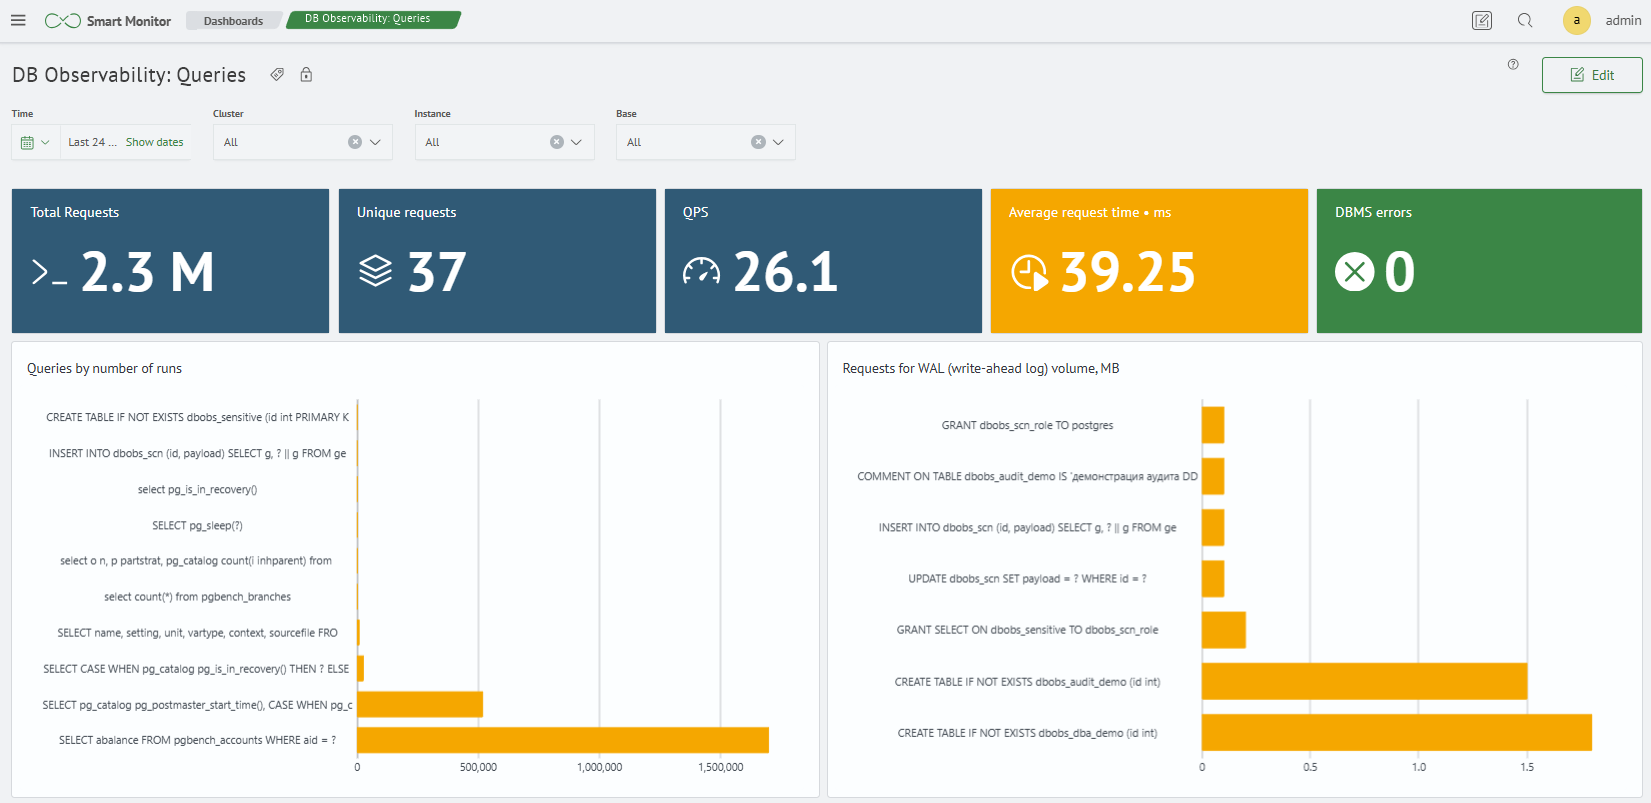
1. Load Summary
Shows the overall query profile:
- execution count, unique query count, and QPS
- average execution time and error count
- distribution of queries by execution count and WAL volume
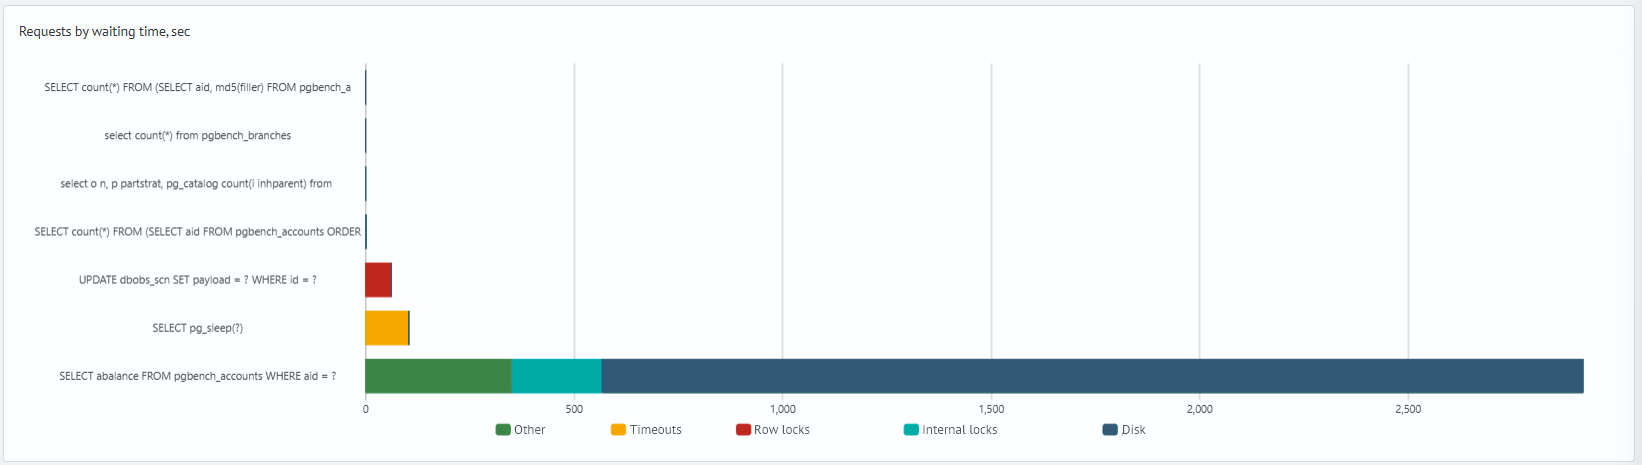
2. Queries by Wait Time
Shows queries with the highest cumulative wait time and the distribution of time by wait type.
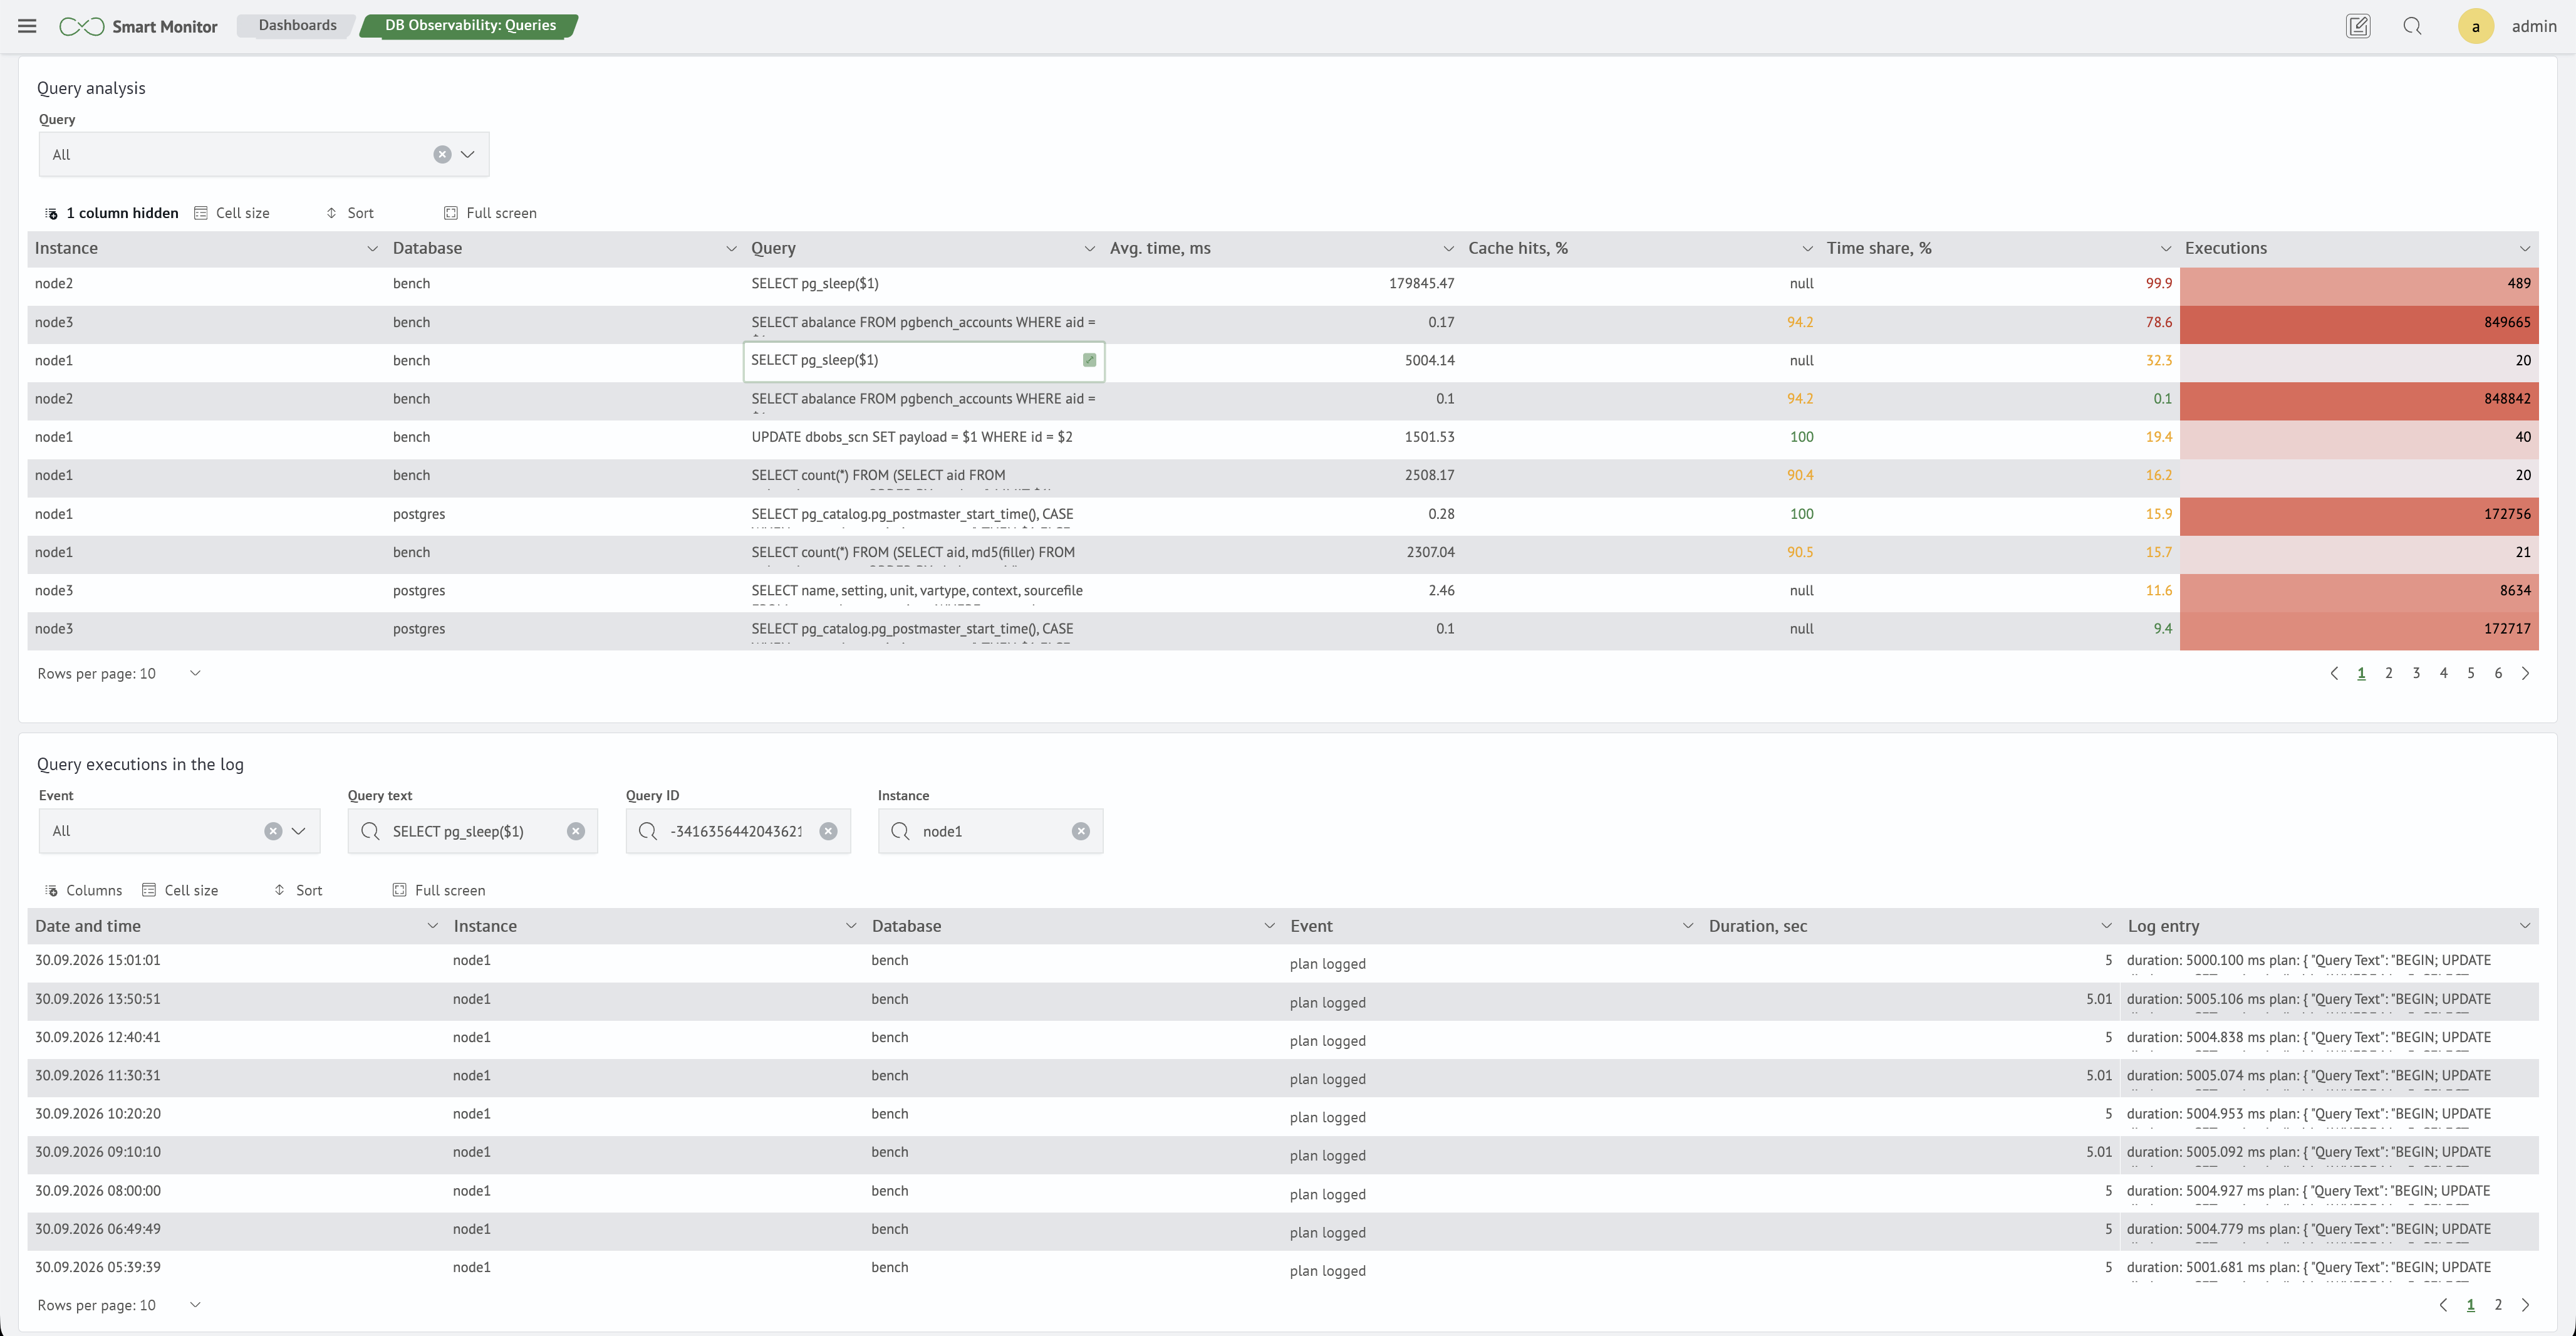
3. Query Analysis
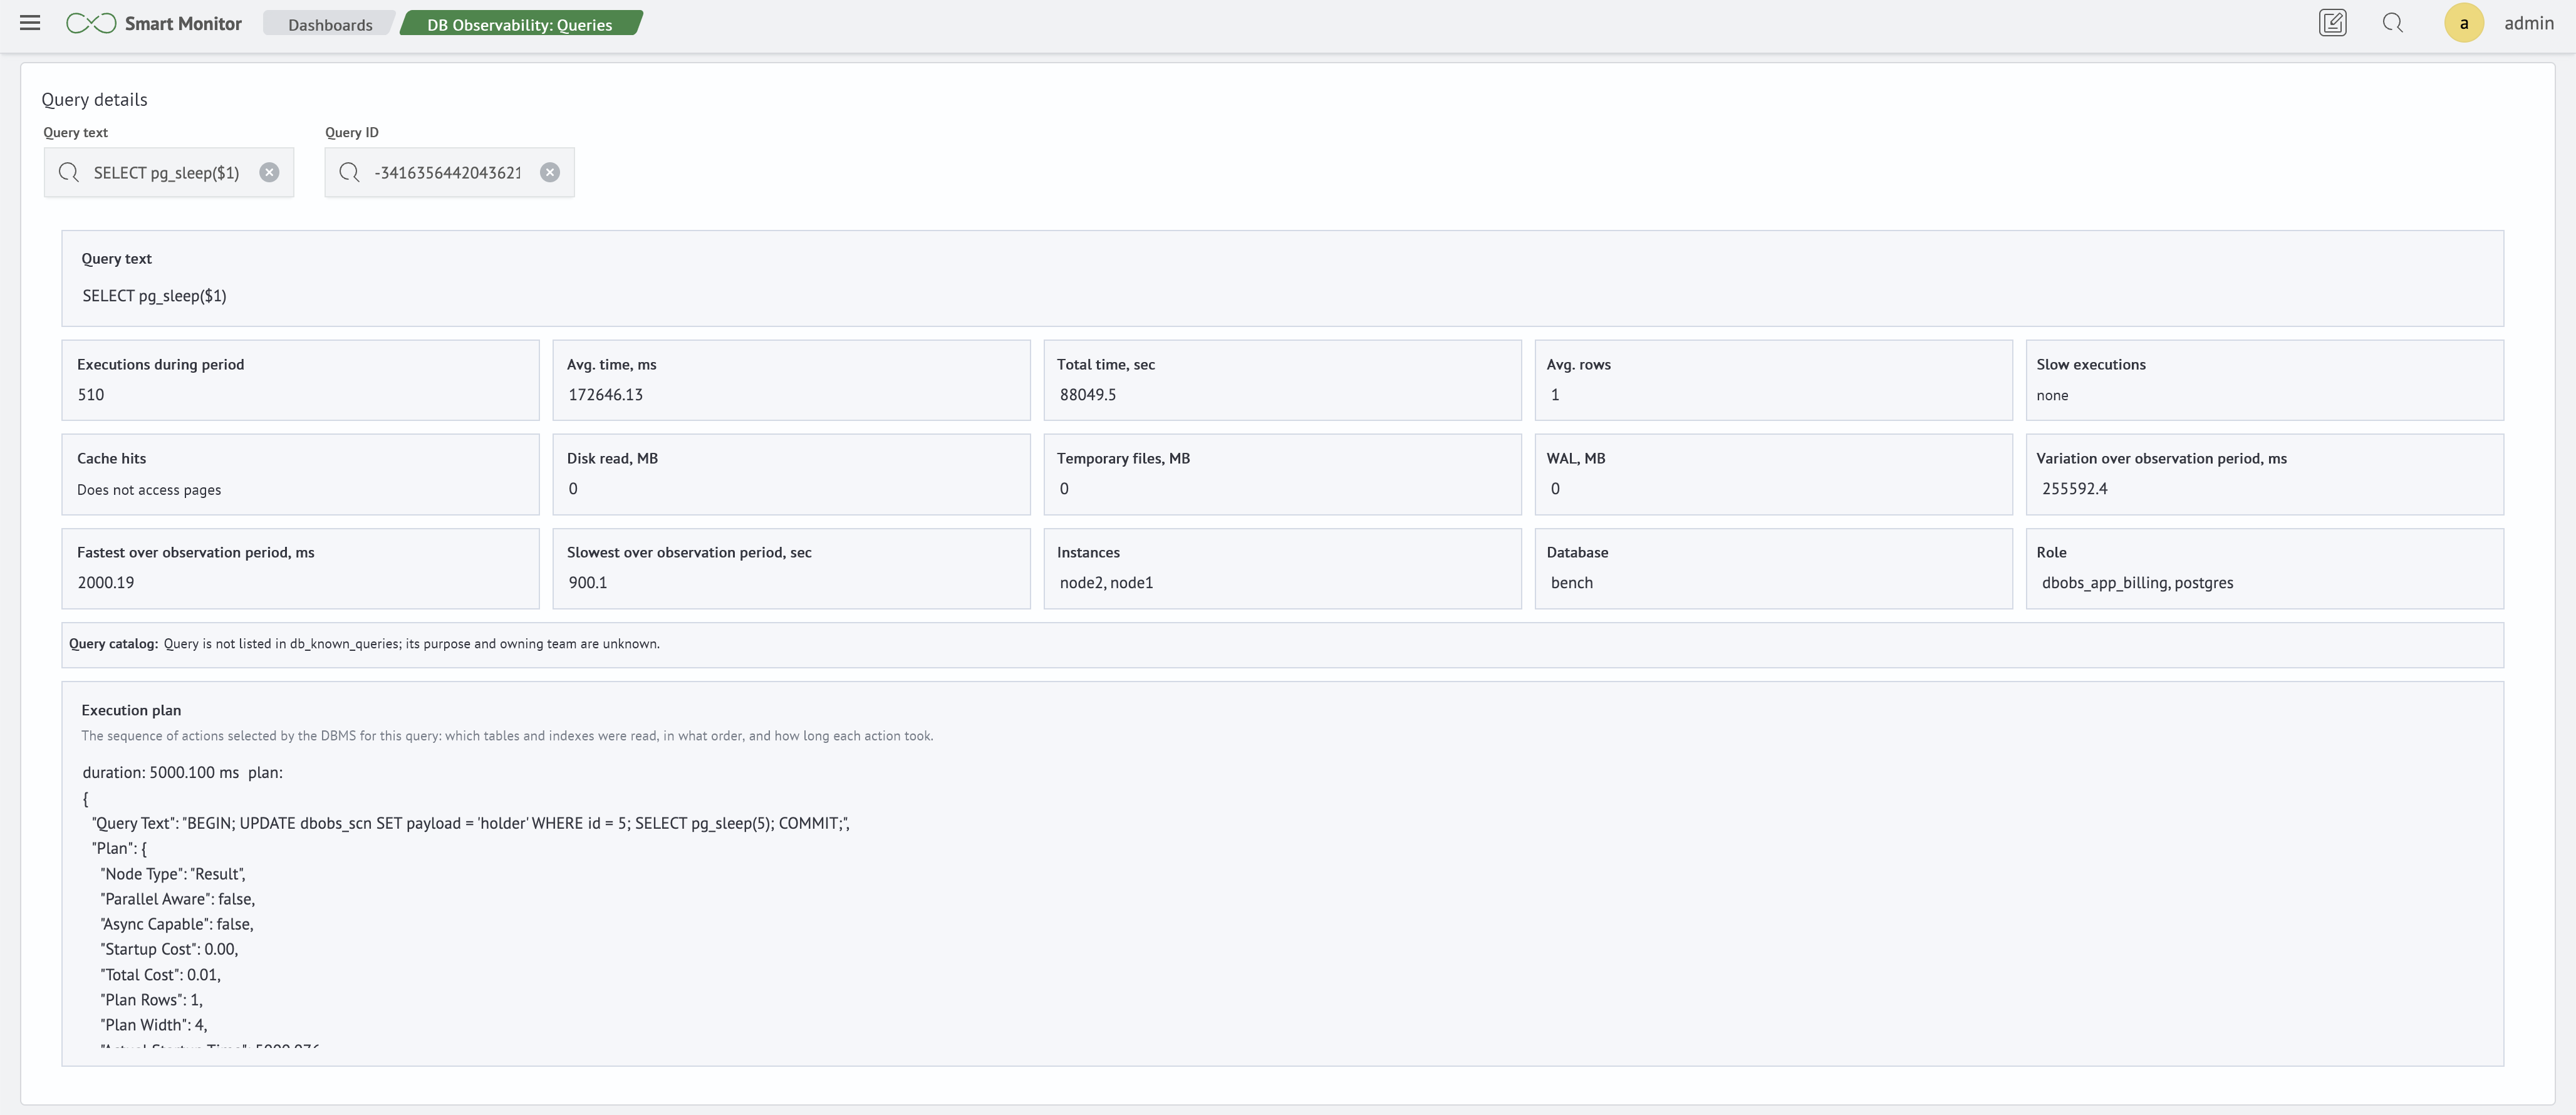
Shows normalized queries, their cumulative cost, execution count, average time, and signs of regression. Selecting a row in this section opens hidden panels with query execution records from the log and a card for the selected query. If an auto_explain plan is available, you can use it for further diagnosis.
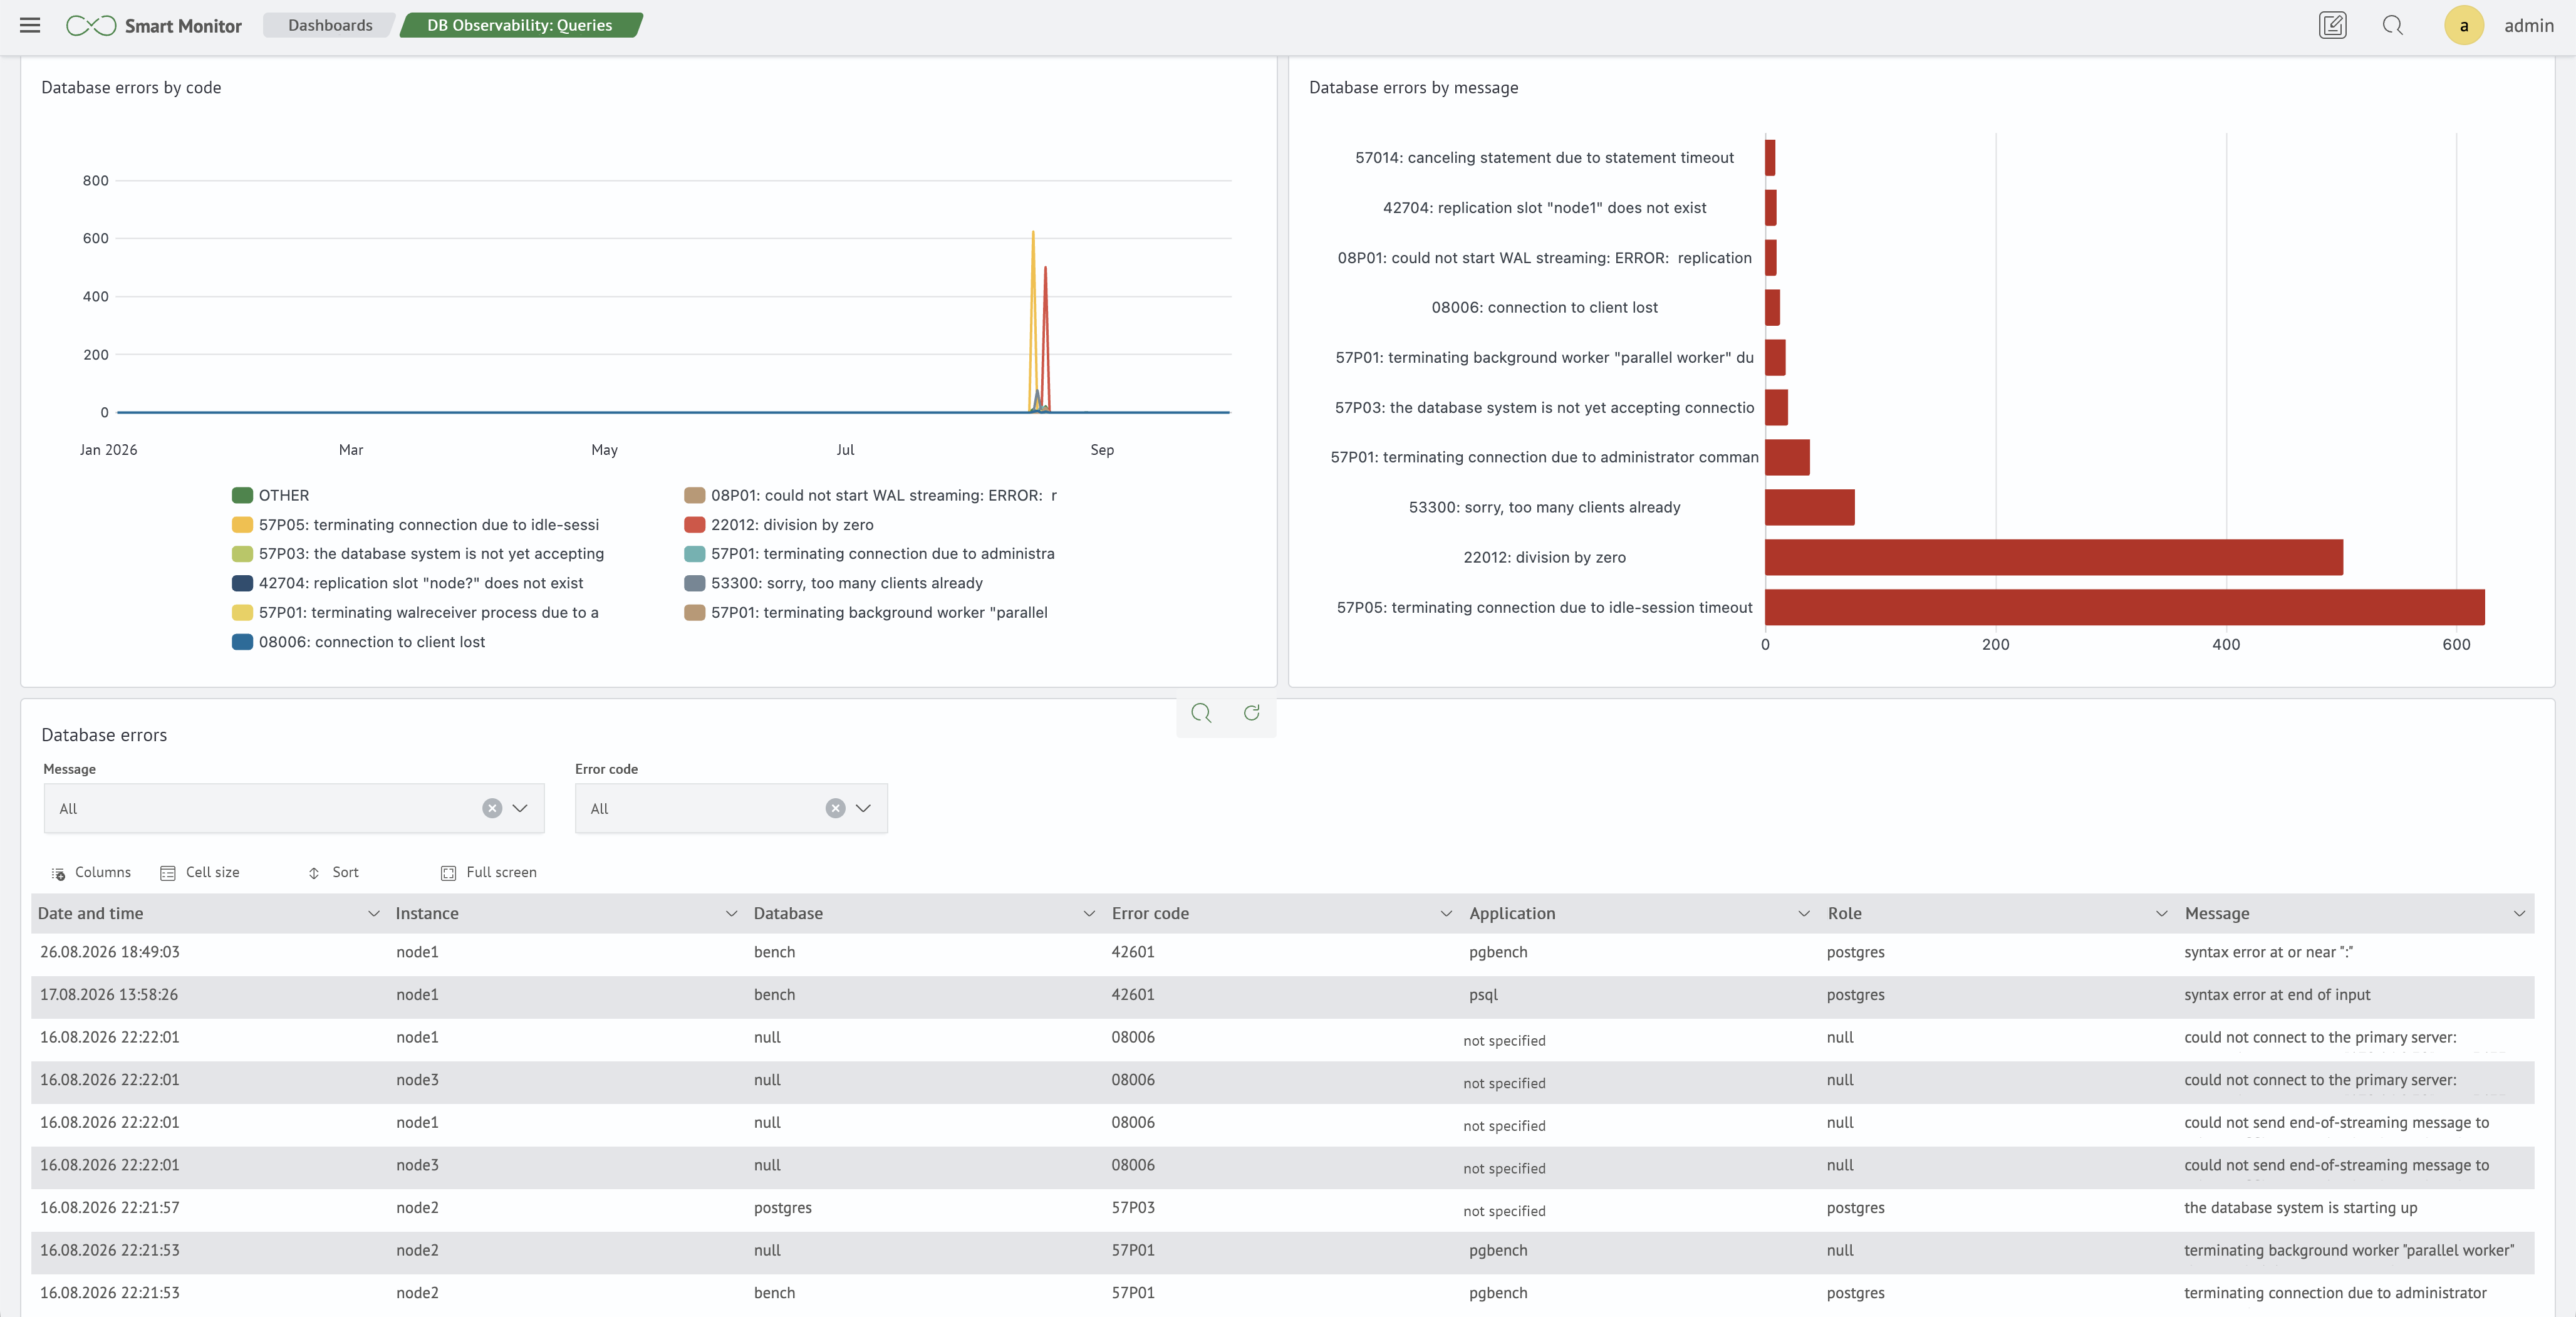
4. Database Errors
Shows the distribution of errors by code and message, along with the original log events for the selected period.