AI Observability: Health Metrics
The AI Observability module provides ready global metrics for the Service Monitor Toolkit module.
They are calculated based on data from gen_ai_* indexes and allow including the AI infrastructure in the organization's overall health model.
Metrics are used as indicators of the AI environment's status in the resource-service model. They enable tracking AI component degradation, setting criticality thresholds, and linking the technical state of AI infrastructure to service impact.
Purpose
Health metrics allow:
- displaying the status of AI components alongside infrastructure and application services
- accounting for GPUs, AI services, traces, and requests in a unified health model
- setting degradation thresholds for key AI infrastructure indicators
- using AI infrastructure as a separate layer in end-to-end service models
Metric Descriptions
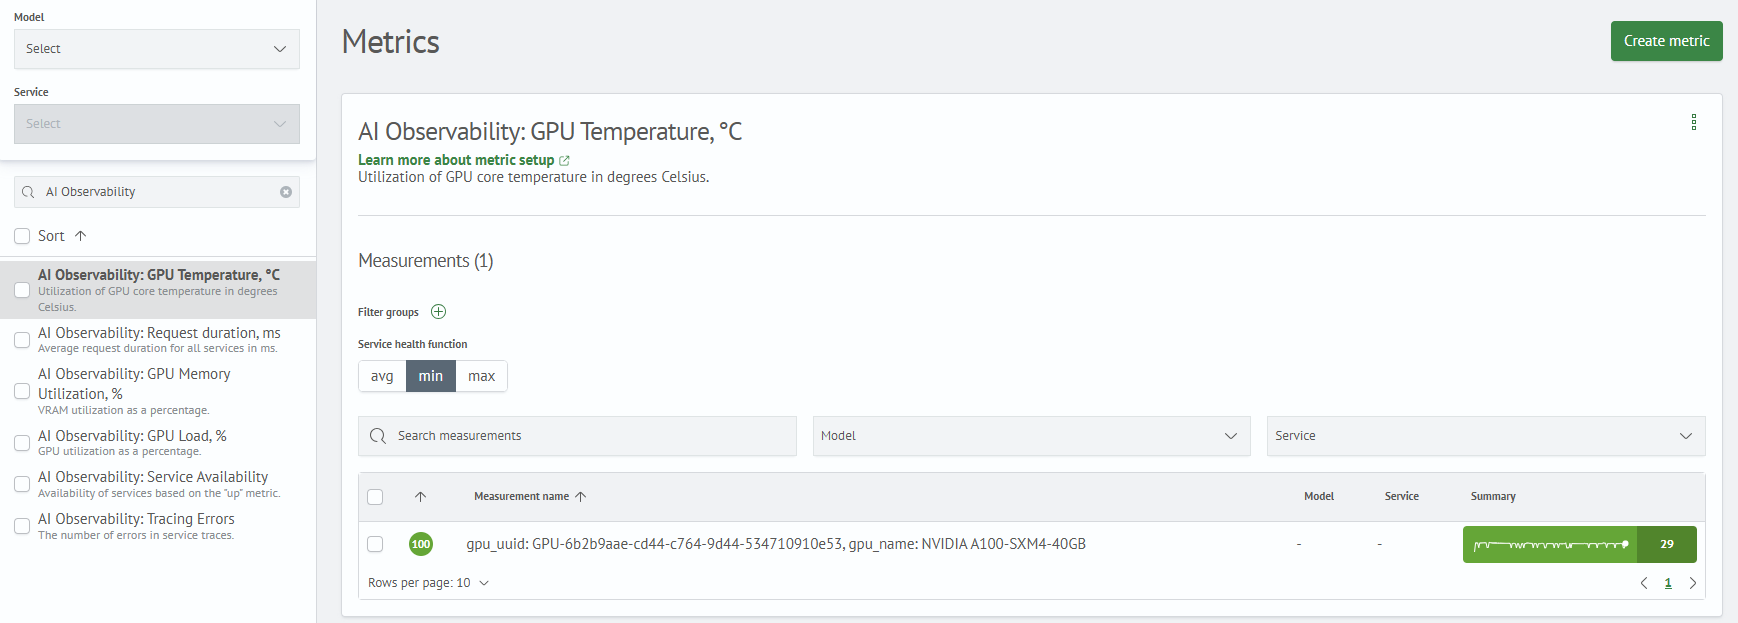
1. GPU Temperature, °C
Data source: gen_ai_gpu_metrics*
The metric shows the GPU core temperature in degrees Celsius. Useful for early detection of hardware degradation: critical GPU heating can affect AI service performance and request processing stability.
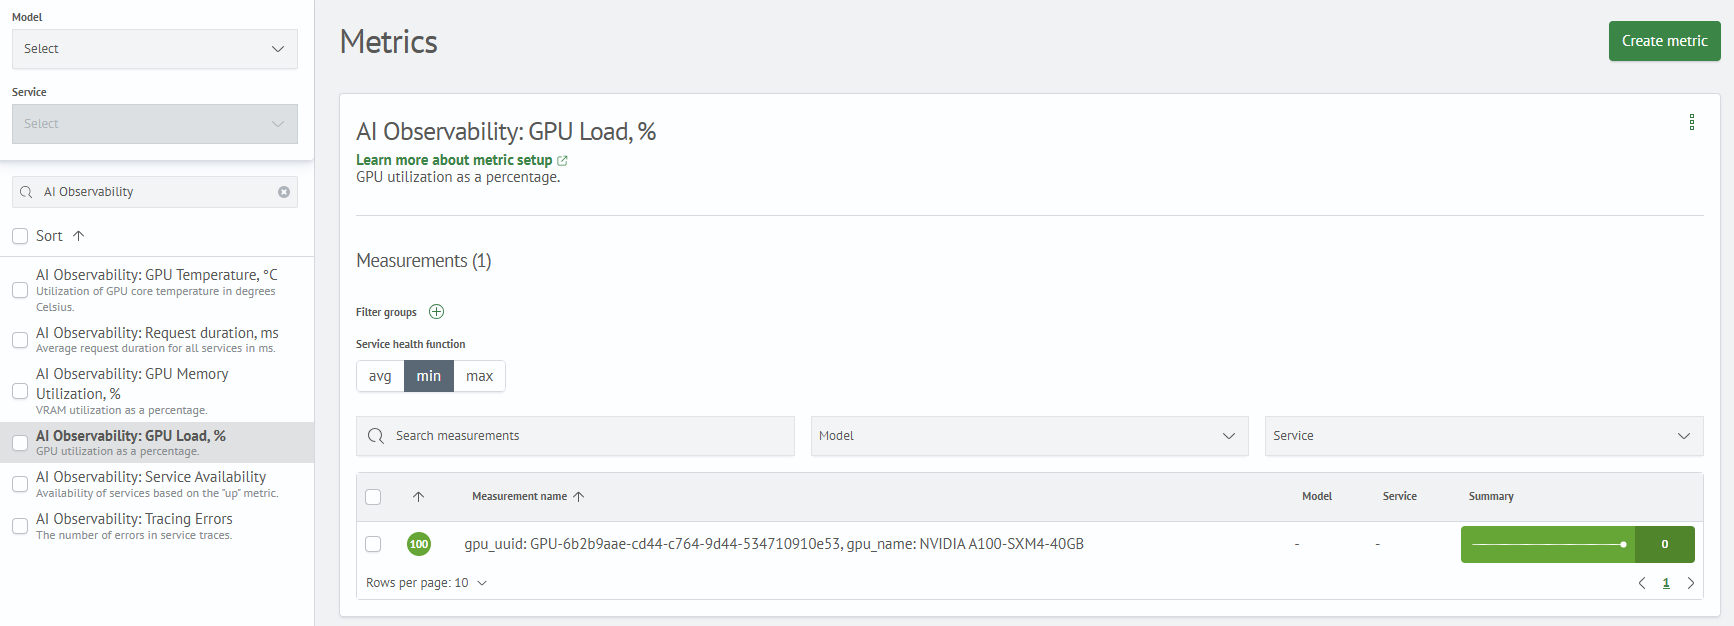
2. GPU Utilization, %
Data source: gen_ai_gpu_metrics*
The metric shows current GPU utilization in percentages. Helps determine if current GPU resources are sufficient for processing AI requests and if infrastructure scaling is required.
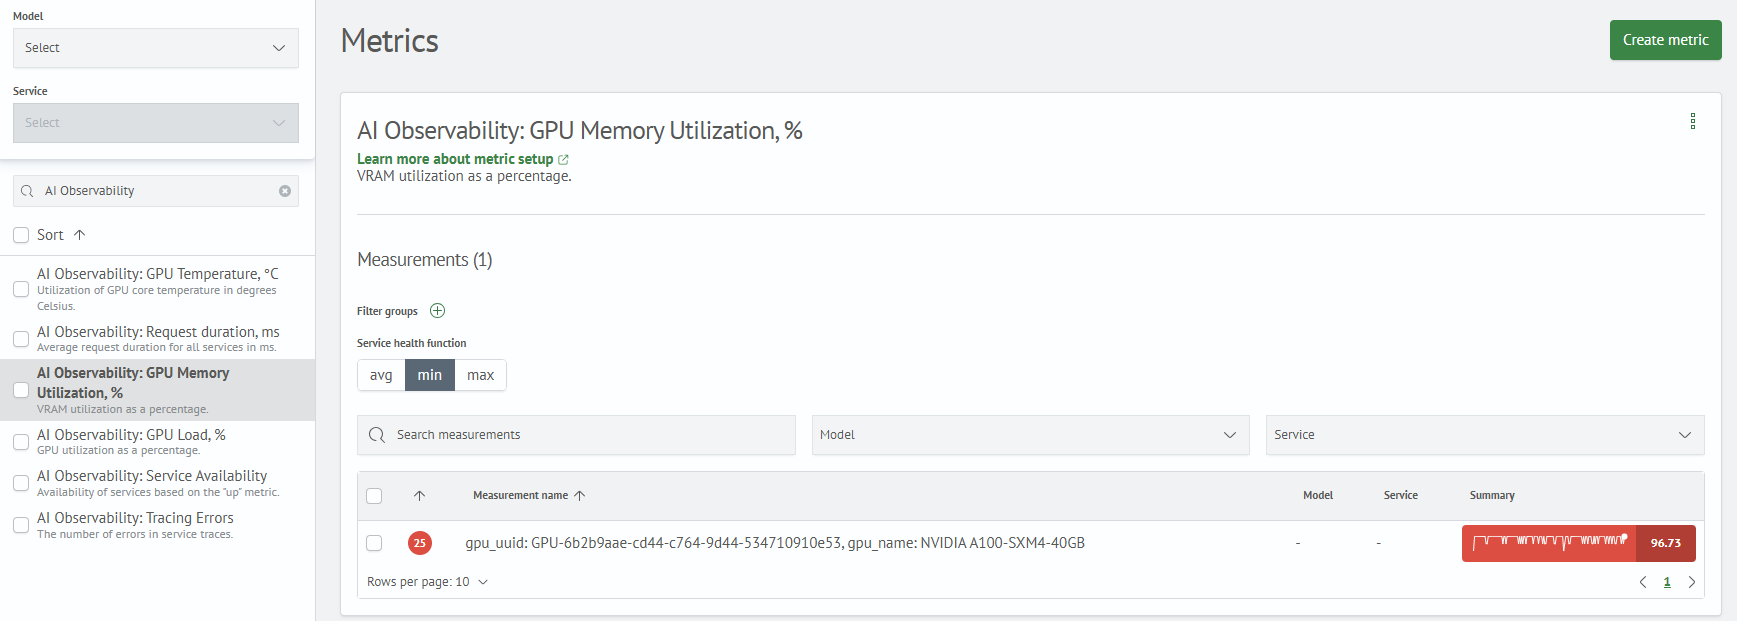
3. GPU Memory Utilization, %
Data source: gen_ai_gpu_metrics*
The metric shows the percentage of occupied GPU video memory. Particularly important for inference scenarios with large LLM models, where video memory reserve directly affects service stability.
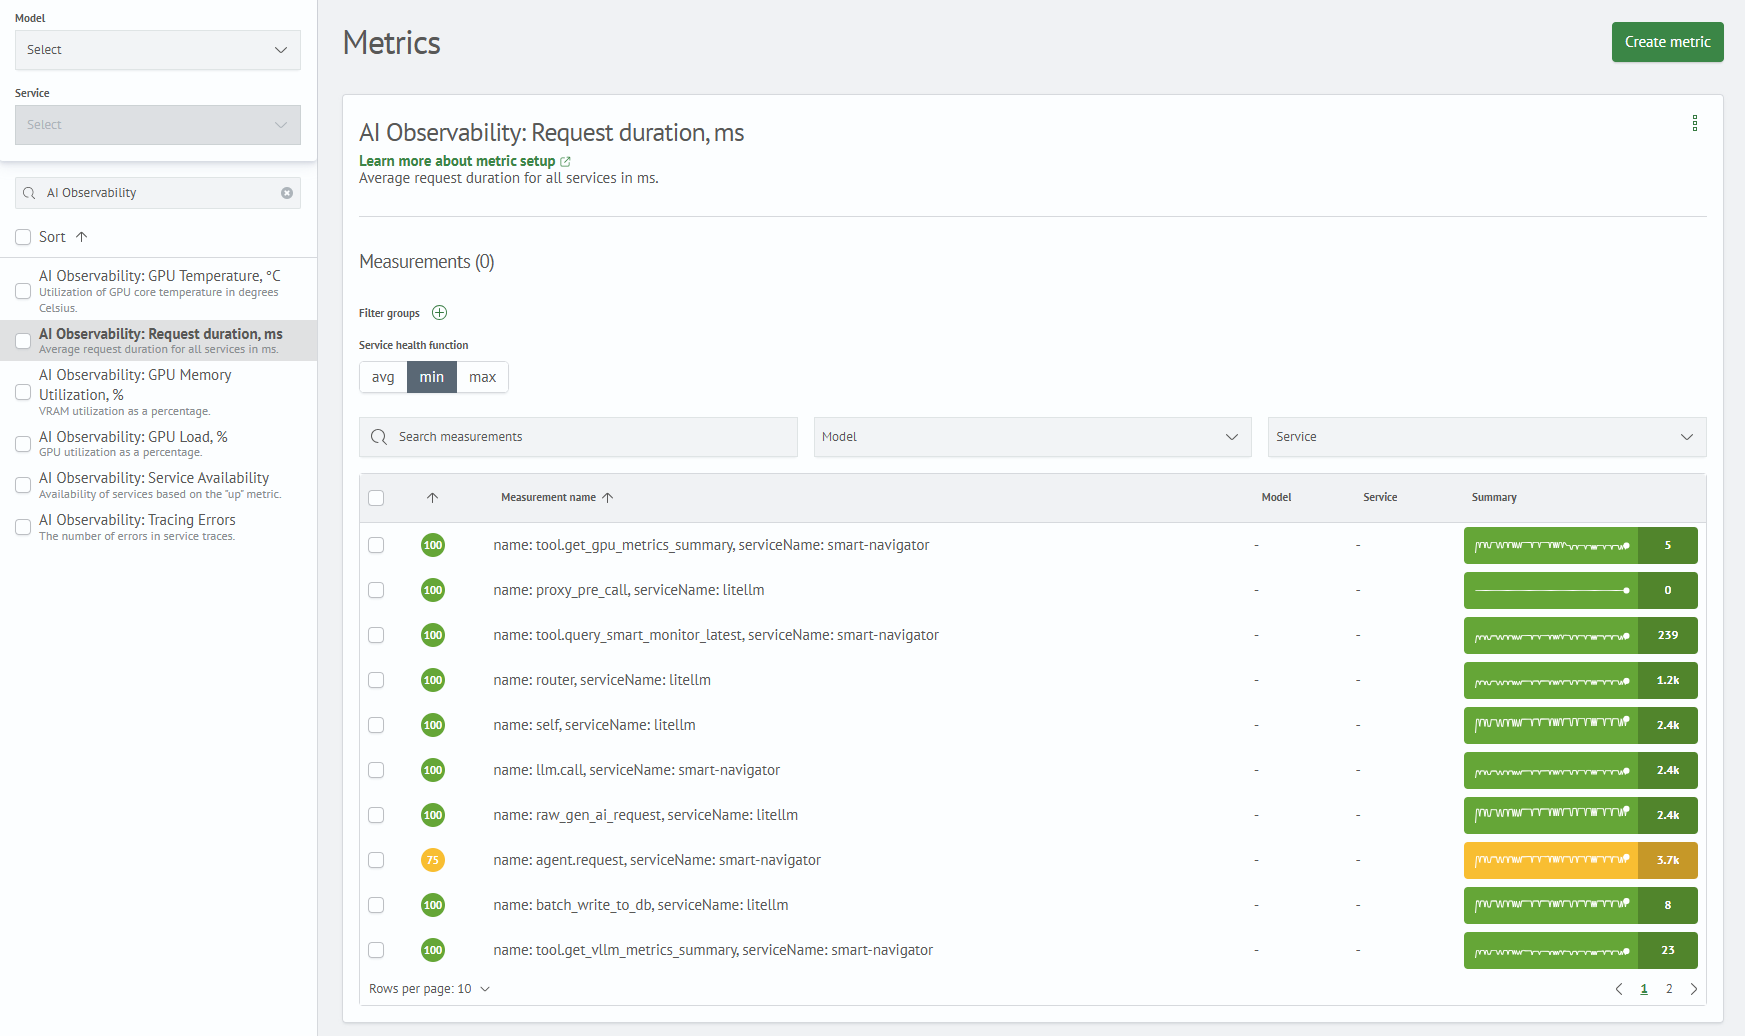
4. Request Duration, ms
Data source: gen_ai_traces*
The metric shows the average duration of AI requests and operations in milliseconds. Helps track AI service performance from a response time perspective and identify degradation before it becomes noticeable to users.
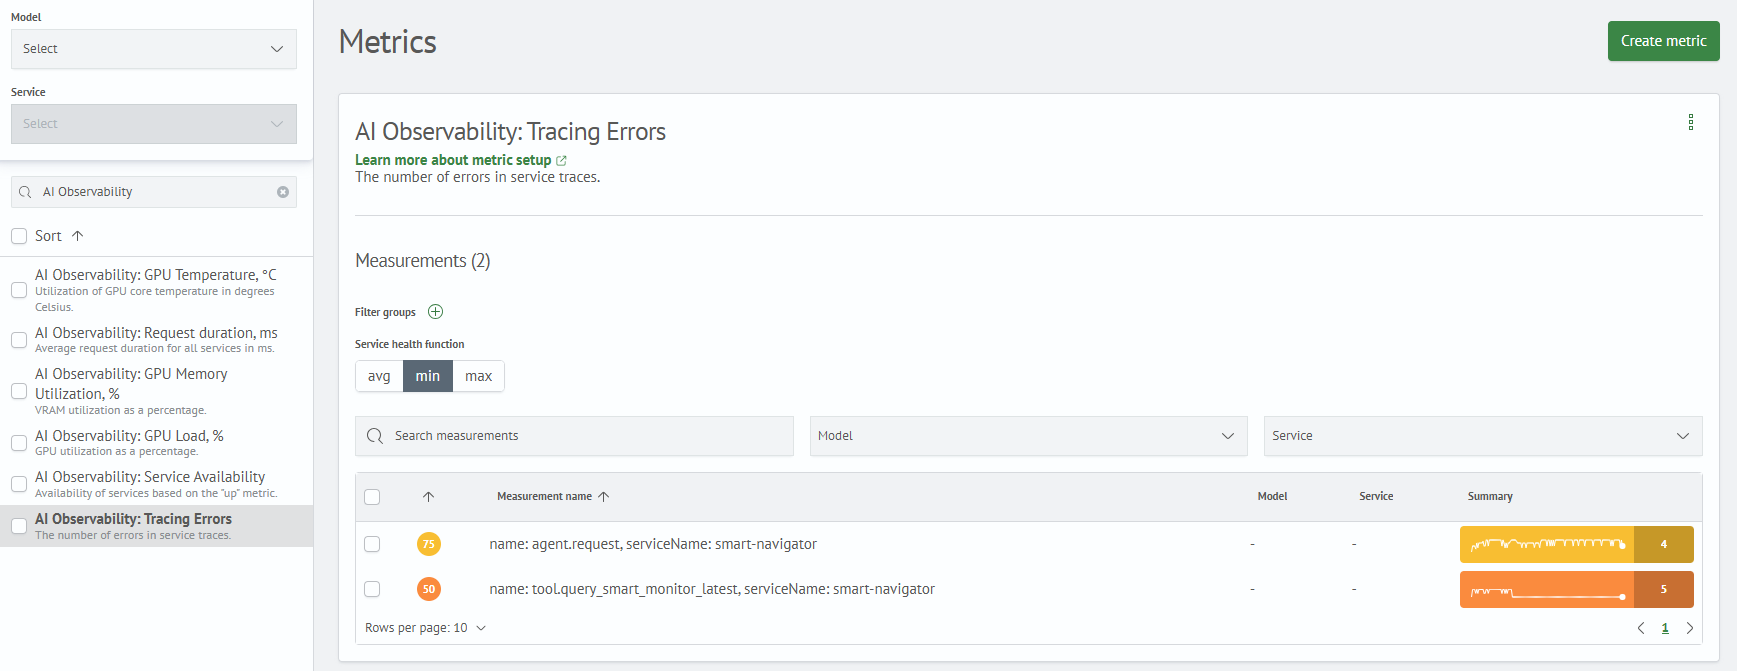
5. Trace Errors
Data source: gen_ai_traces*
The metric shows the number of errors recorded in AI service traces. Helps quickly determine that degradation is related not only to load or delays but also to execution errors.
6. Service Availability
Data source: gen_ai_metrics*
The metric shows AI service availability by the up metric. Allows accounting for AI service availability in the overall health model and quickly seeing which component has stopped transmitting data.

Operations Application
Health metrics allow:
- Getting early degradation signals — rising GPU temperature, memory utilization, errors, or request duration is visible before the problem affects users
- Controlling AI infrastructure in the overall health model — GPUs, AI services, and traces become part of a unified resource-service model
- Setting criticality thresholds — metric values can be adapted to the specifics of a particular stand, load, and used models
- Linking technical failures to service impact — AI component degradation can be accounted for when calculating the status of related services
Health metrics are installed by the ai_observability_ko_maker utility.