AI Observability: LLM Costs
The AI Observability: LLM Costs dashboard is designed to control LLM request consumption and costs.
It helps understand how many tokens and resources are consumed, which models and providers are most expensive, and identify abnormal cost growth.
Useful for: operations engineers, AI team managers, financial analysts.
Data source: gen_ai_cost*
Main Sections
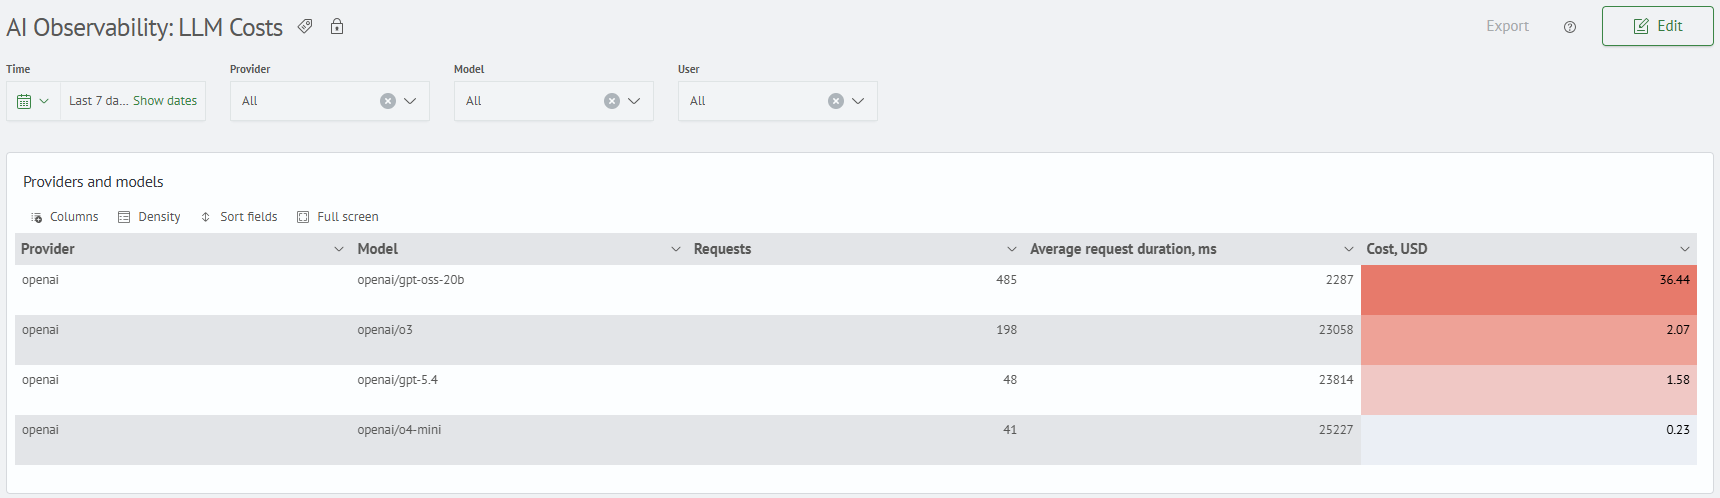
1. Providers and Models
Shows a summary table of LLM providers and models that were used during the selected period:
- number of requests by models
- average request execution duration
- cost of model usage
- cost comparison between providers and models
2. Tokens and Cost Summary
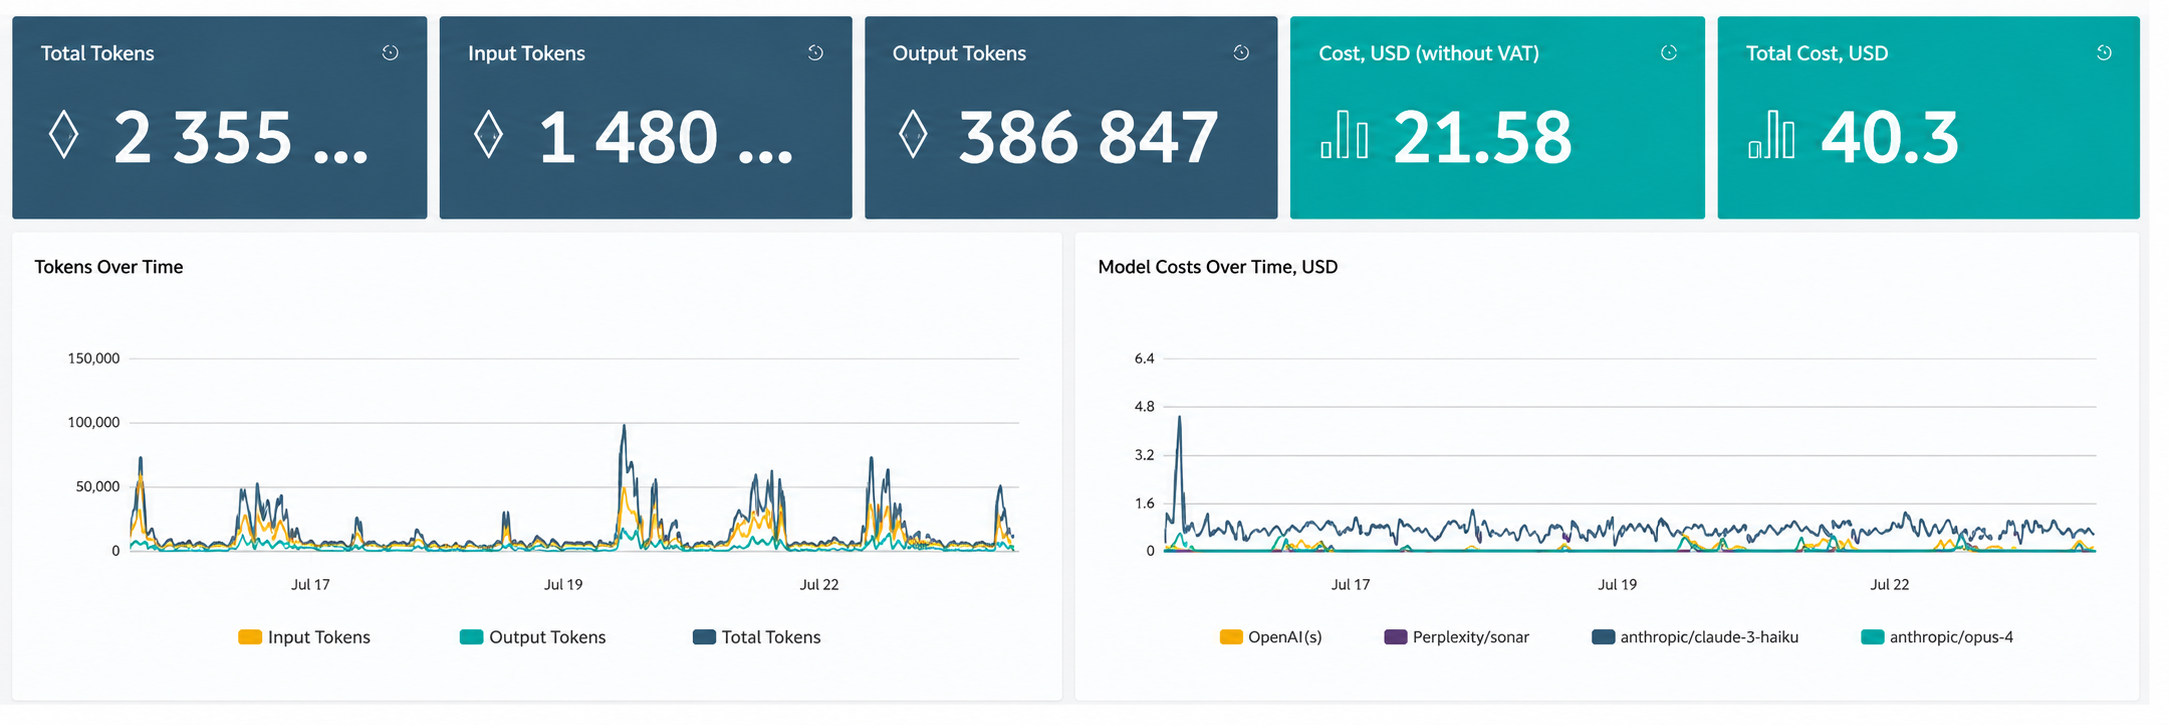
Shows key LLM consumption indicators and cost dynamics over time:
- total token consumption
- input and output tokens
- cost per 1M tokens
- total cost of model usage
- dynamics of tokens, requests, and costs over time
3. Cost Distribution and Expensive Requests
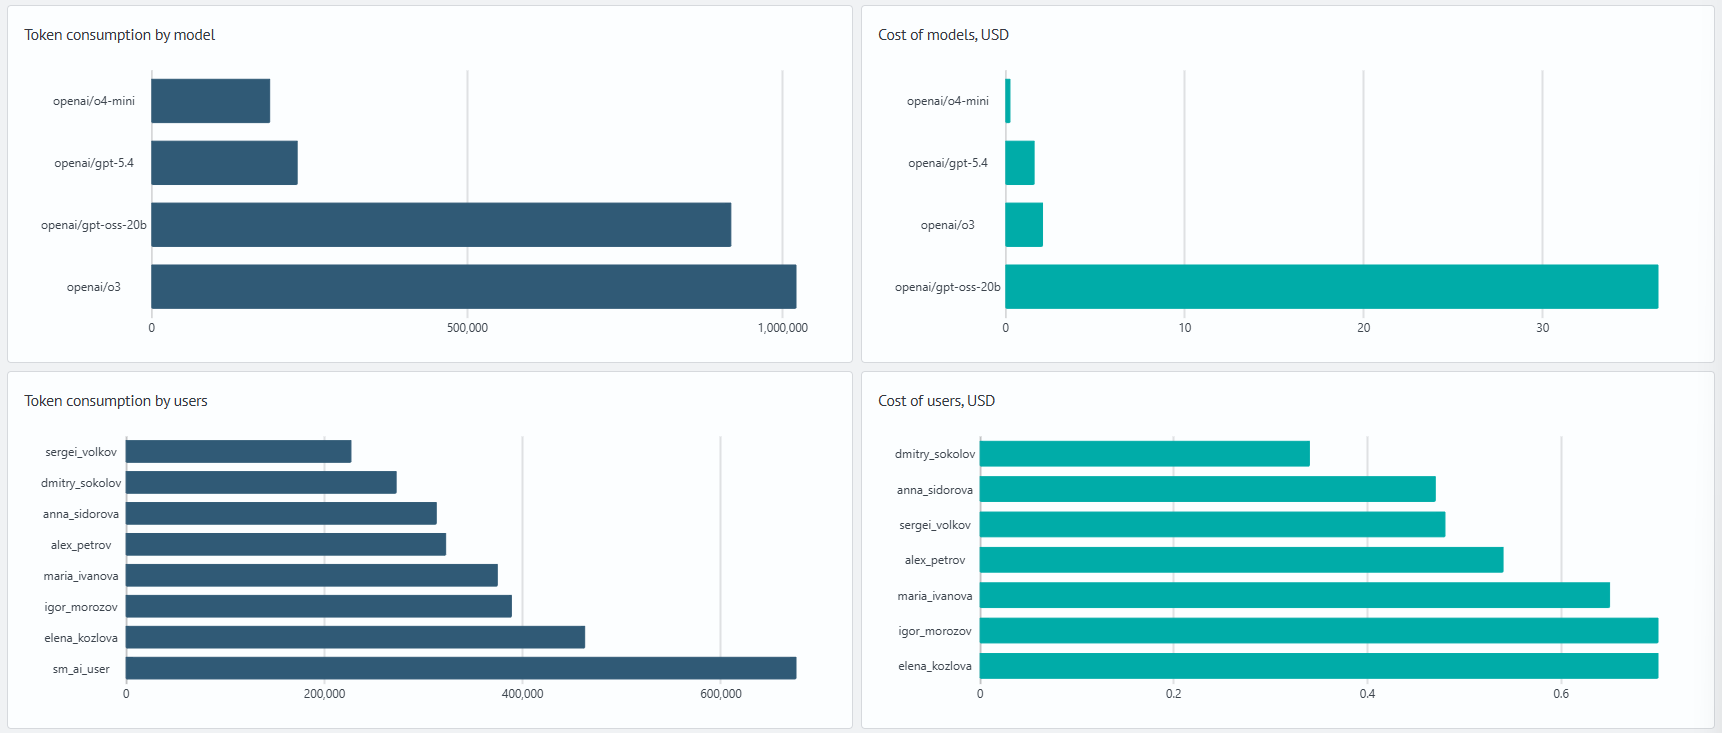
Shows which models generate the main token and cost consumption, and allows detailed analysis of the most expensive LLM requests:
- token usage and cost by model
- token usage and cost by user
- comparison of models by usage volume and cost
- identification of the most expensive models and users
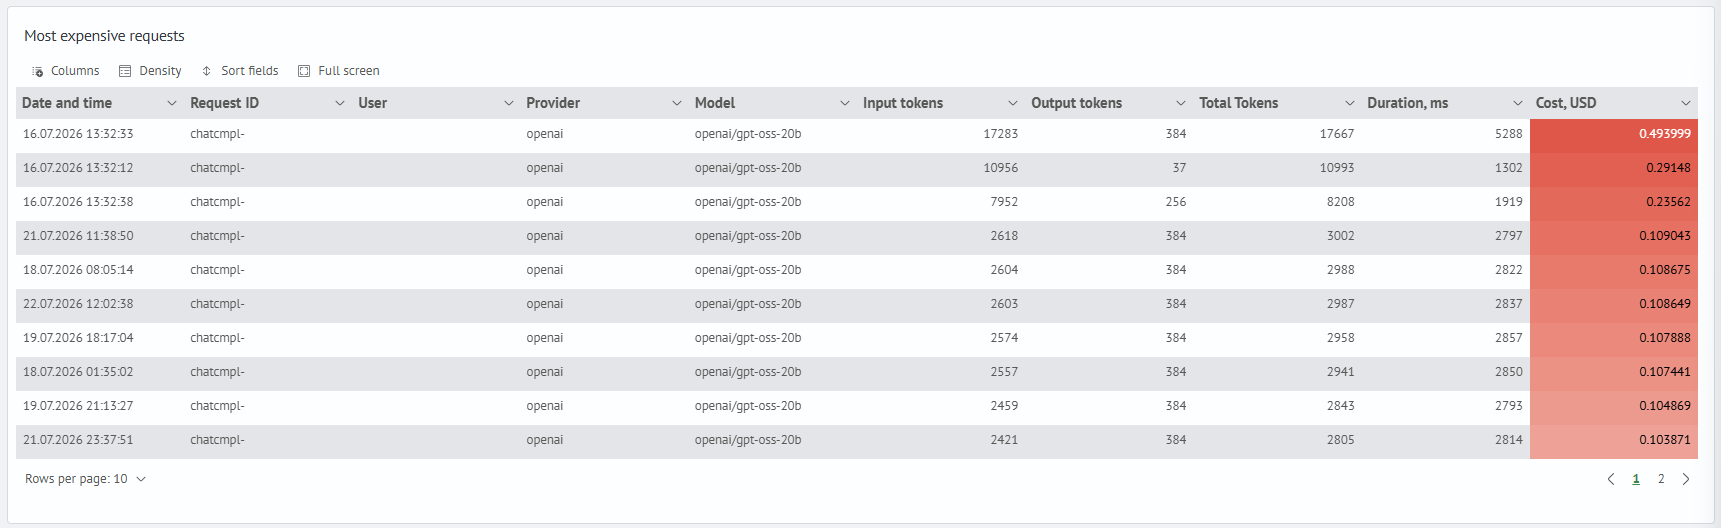
4. Most Expensive Requests
Displays the LLM requests with the highest cost for the selected period:
- request execution time
- request ID and user
- provider and model
- input, output, and total tokens
- request duration and cost