AI Observability: Codex
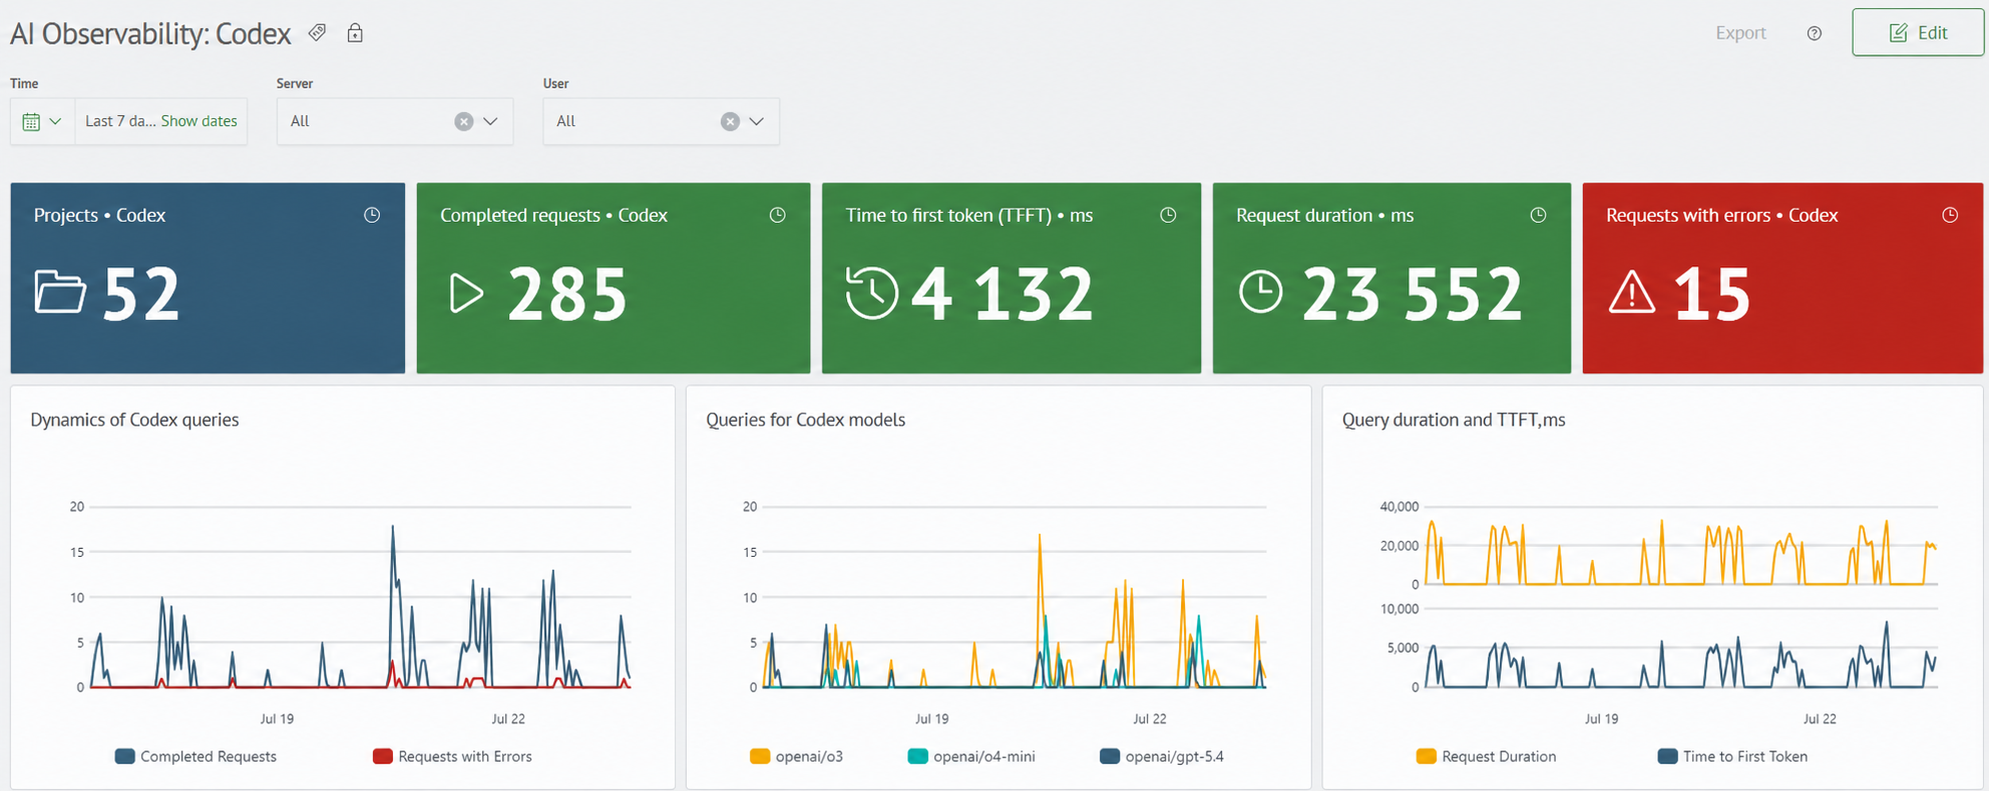
The AI Observability: Codex dashboard is designed to monitor local Codex activity.
It displays requests, performance (including TTFT), token consumption, cache, and details by users, projects, and sessions.
Useful for: operations engineers, developers, performance analysts.
Data sources: gen_ai_events*, gen_ai_cost*
Main Sections
1. Codex Activity
Shows summary activity of Codex for the selected period:
- number of working projects, completed requests, and requests with errors
- dynamics of requests, models, and performance metrics over time
2. Codex Dialogs
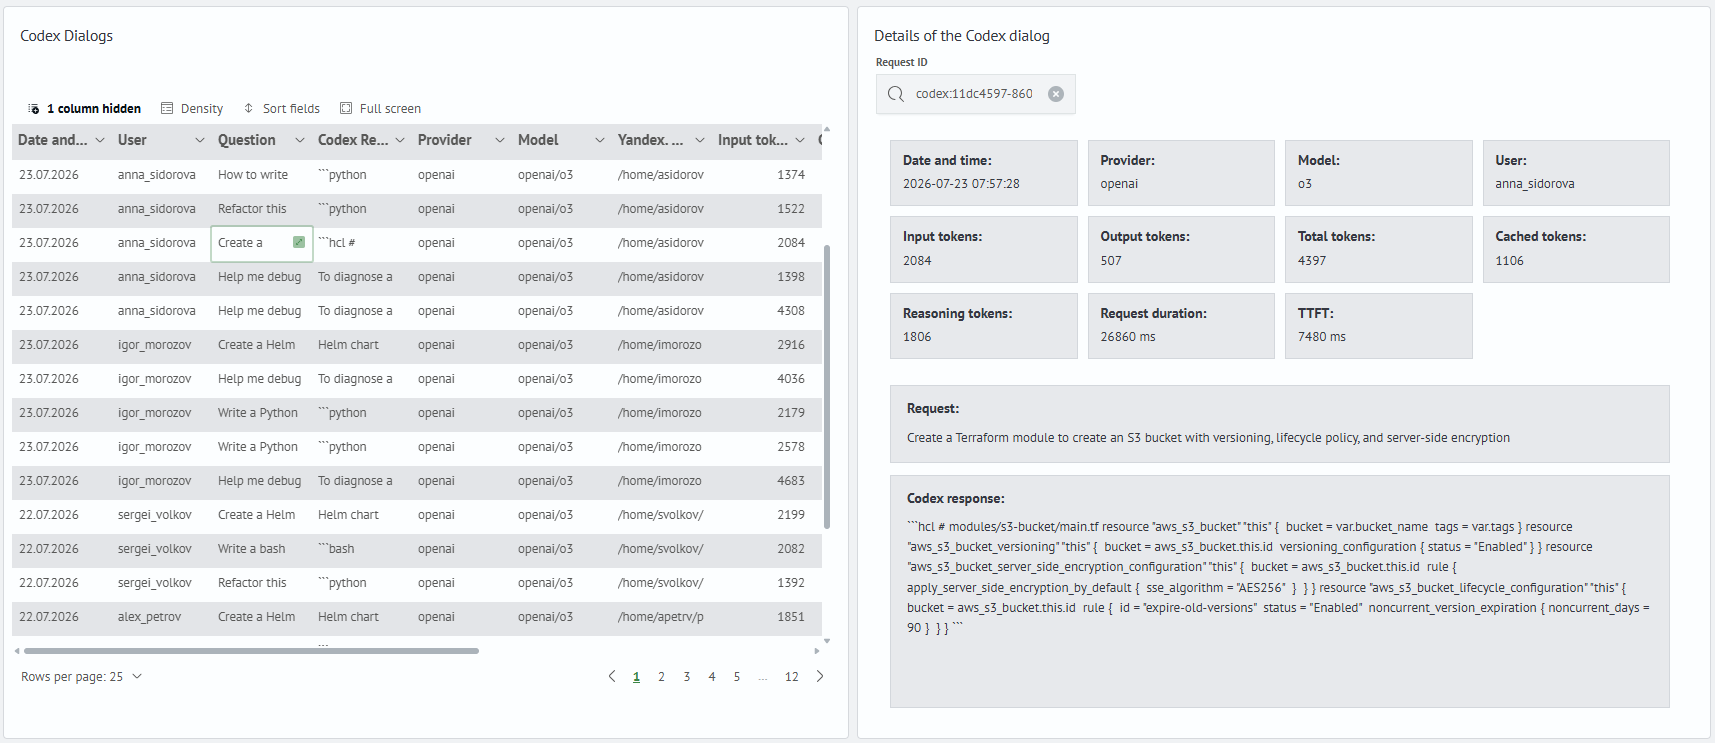
Shows a table of Codex dialogs and details of the selected interaction:
- request execution time
- user and project working directory
- request and response text
- provider, model, and token consumption
- drilldown panel with details of the selected dialog
When selecting a dialog, the Codex Dialog Details panel opens, displaying request parameters, tokens, model, user, project directory, question text, and the full Codex response.
3. Tokens, Users, and Projects
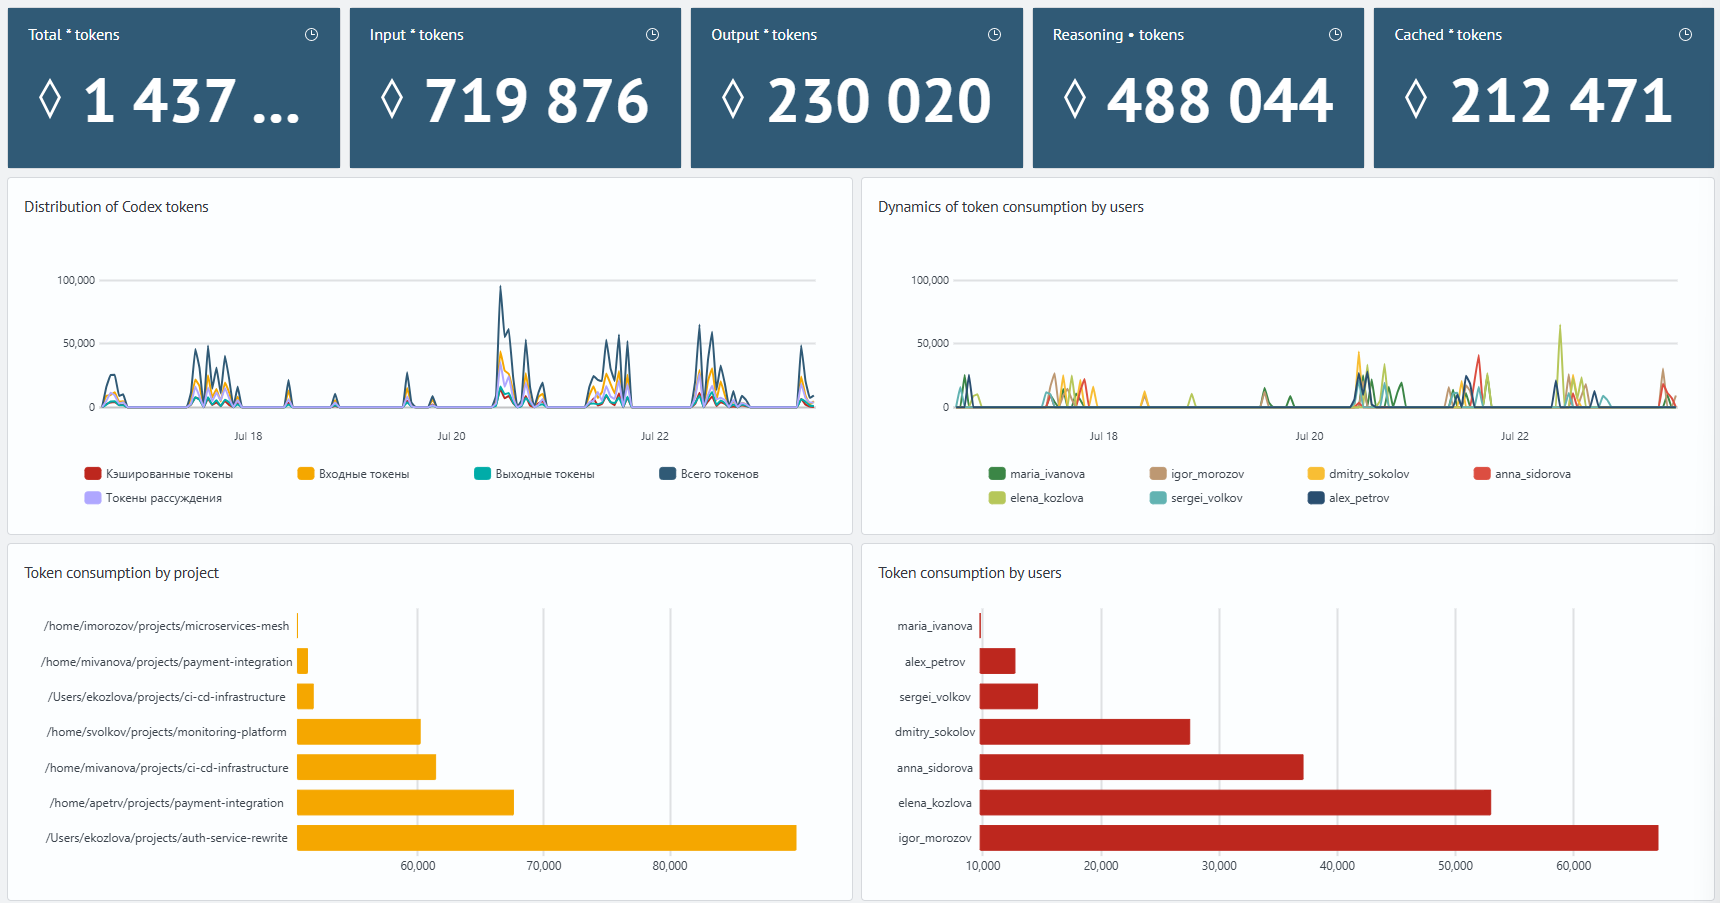
Shows Codex token consumption broken down by time, users, and working projects:
- total token consumption
- input, output, reasoning, and cached tokens
- token distribution over time
- token consumption by users
- token consumption by projects
4. Projects and Sessions
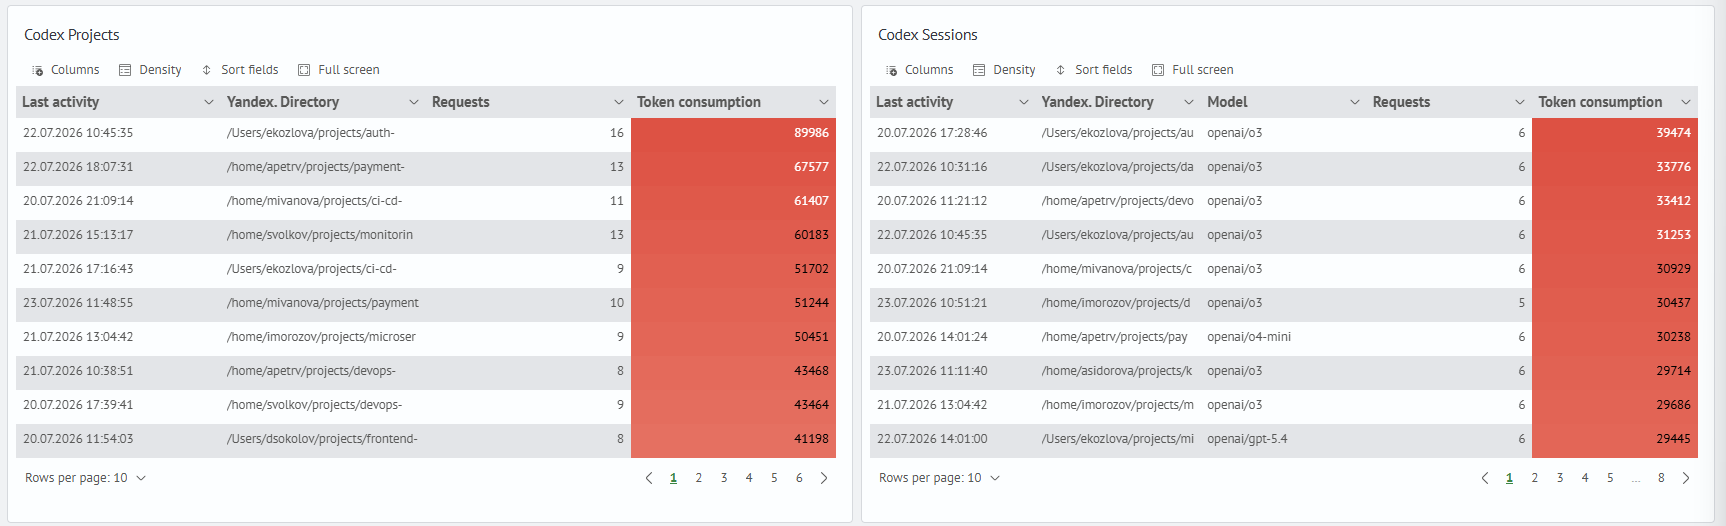
Shows Codex usage context by working projects and sessions:
- active project working directories
- number of requests by projects
- total token consumption
- cached tokens and average request duration
- model interaction sessions