AI Observability: Claude Code - Team and Productivity
The AI Observability: Claude Code - Team and Productivity dashboard shows the outcomes of a team's work with Claude Code and the associated costs.
It includes PRs, commits, and code lines; the share of accepted suggestions; skills, MCP servers, and tools used; and the cost per commit, PR, and session.
Useful for: team leads and development managers.
Data sources: gen_ai_metrics*, gen_ai_events*, and the claude_code_members lookup.
Main Sections
1. Outcomes and Activity
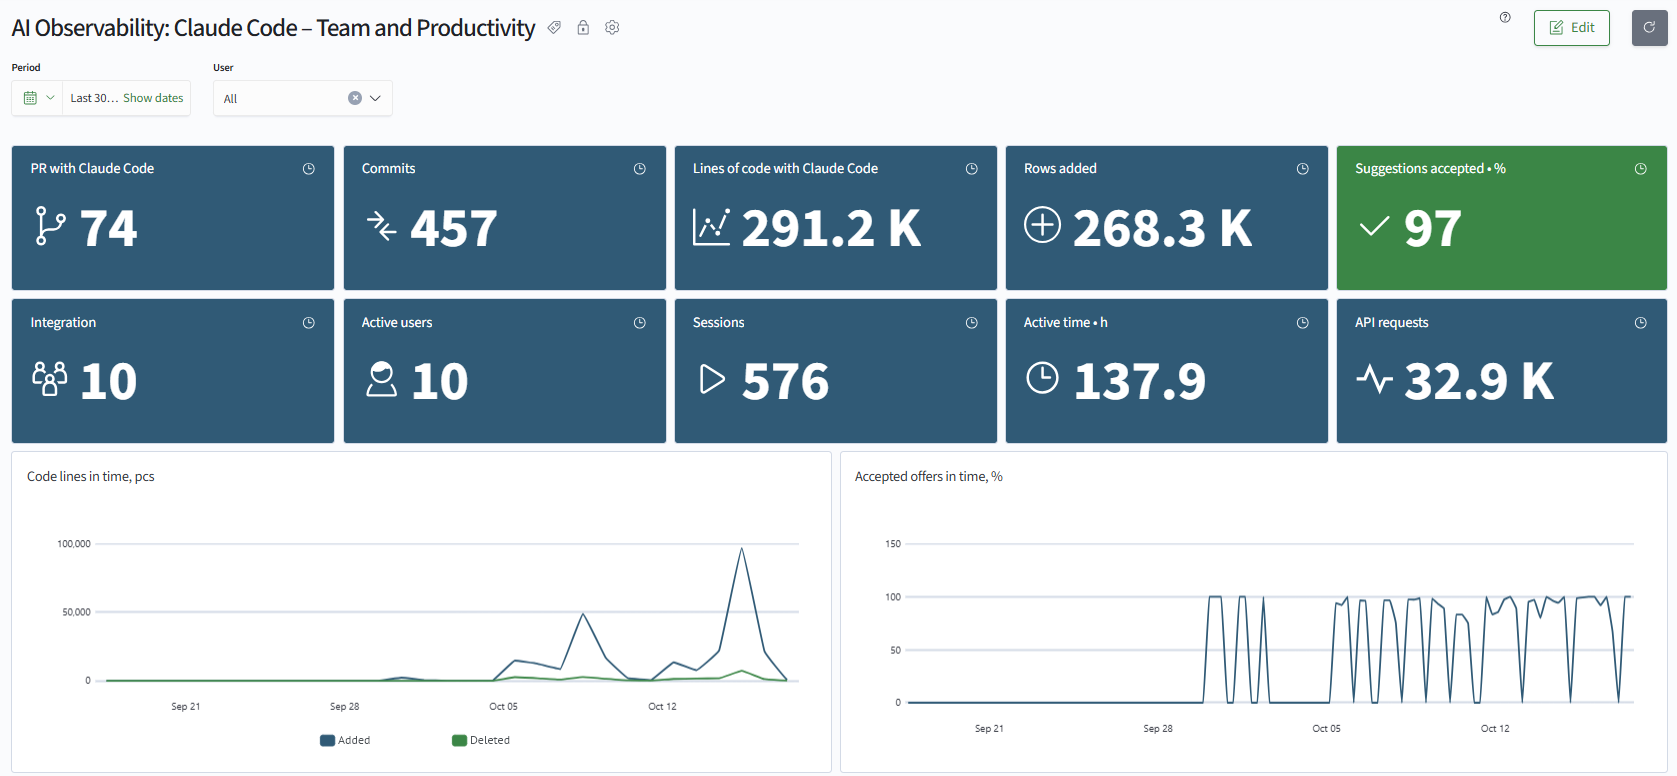
Shows the team's outcomes for the period:
- PRs and commits created with Claude Code, total code lines, and added lines
- share of accepted edit suggestions
- number of active members, sessions, active time, and API requests
- code lines and the share of accepted suggestions over time
2. Member Contributions
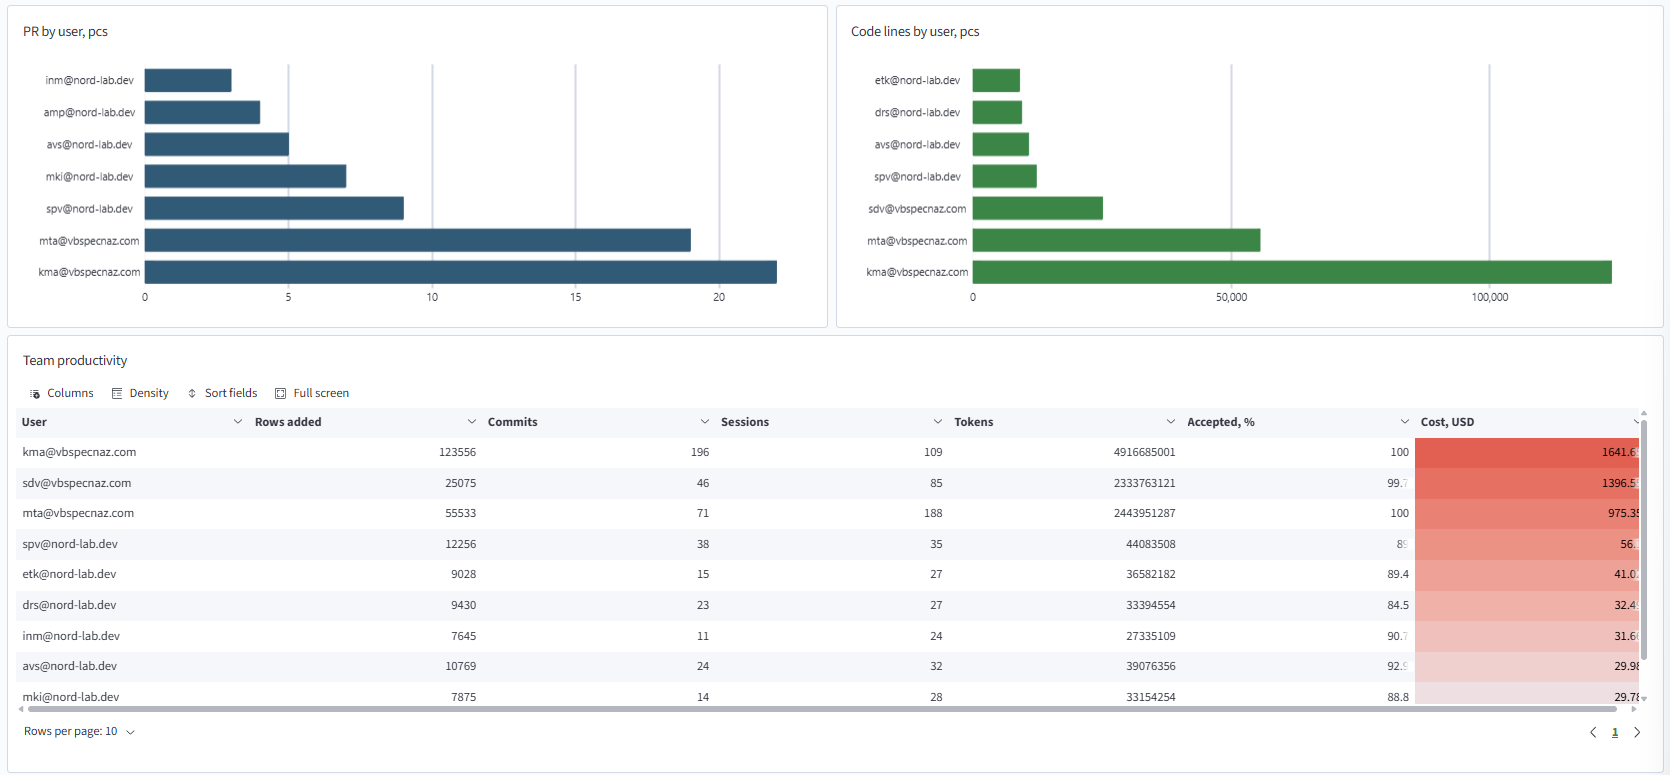
Shows outcomes by member:
- PRs and added code lines by member
- a productivity table with added lines, commits, sessions, tokens, share of accepted suggestions, and spending per member
3. Skills and MCP Servers
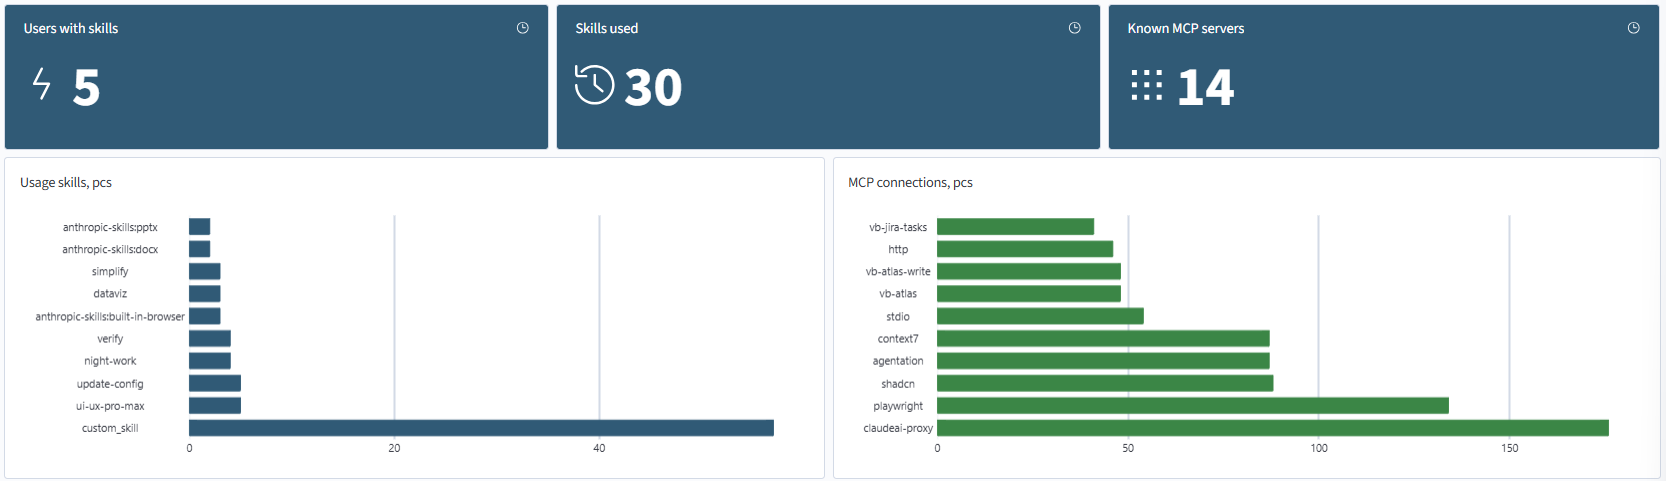
Shows how widely Claude Code extensions are used within the team:
- numbers of members using skills, distinct skills, and known MCP servers
- skills by number of activations
- MCP servers by number of connections
4. Tools and Clients
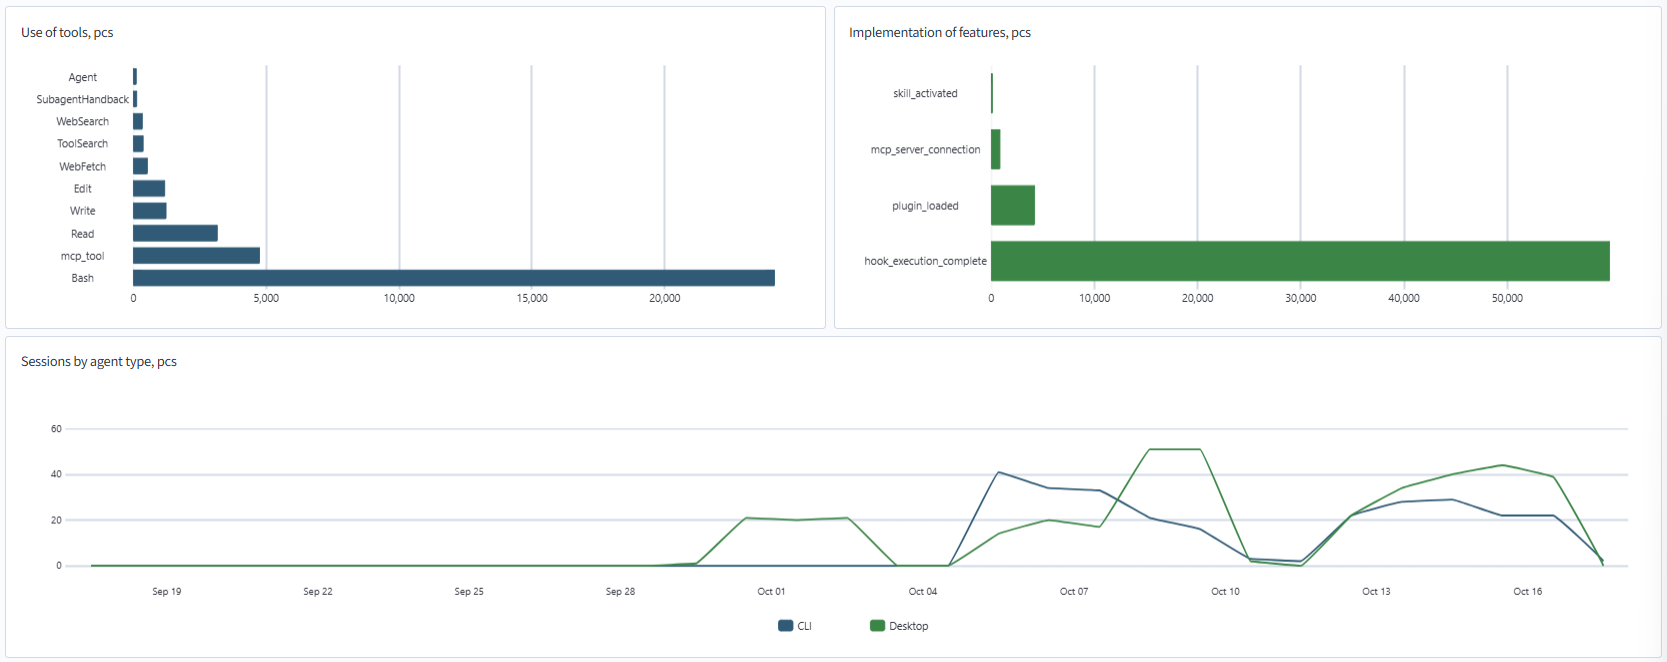
Shows how the team works with Claude Code:
- most frequently used tools by number of calls
- MCP server connections, plugin loads, skill activations, and hook executions
- daily sessions in the command-line client (CLI) and desktop application (Desktop)
5. Value and Trends
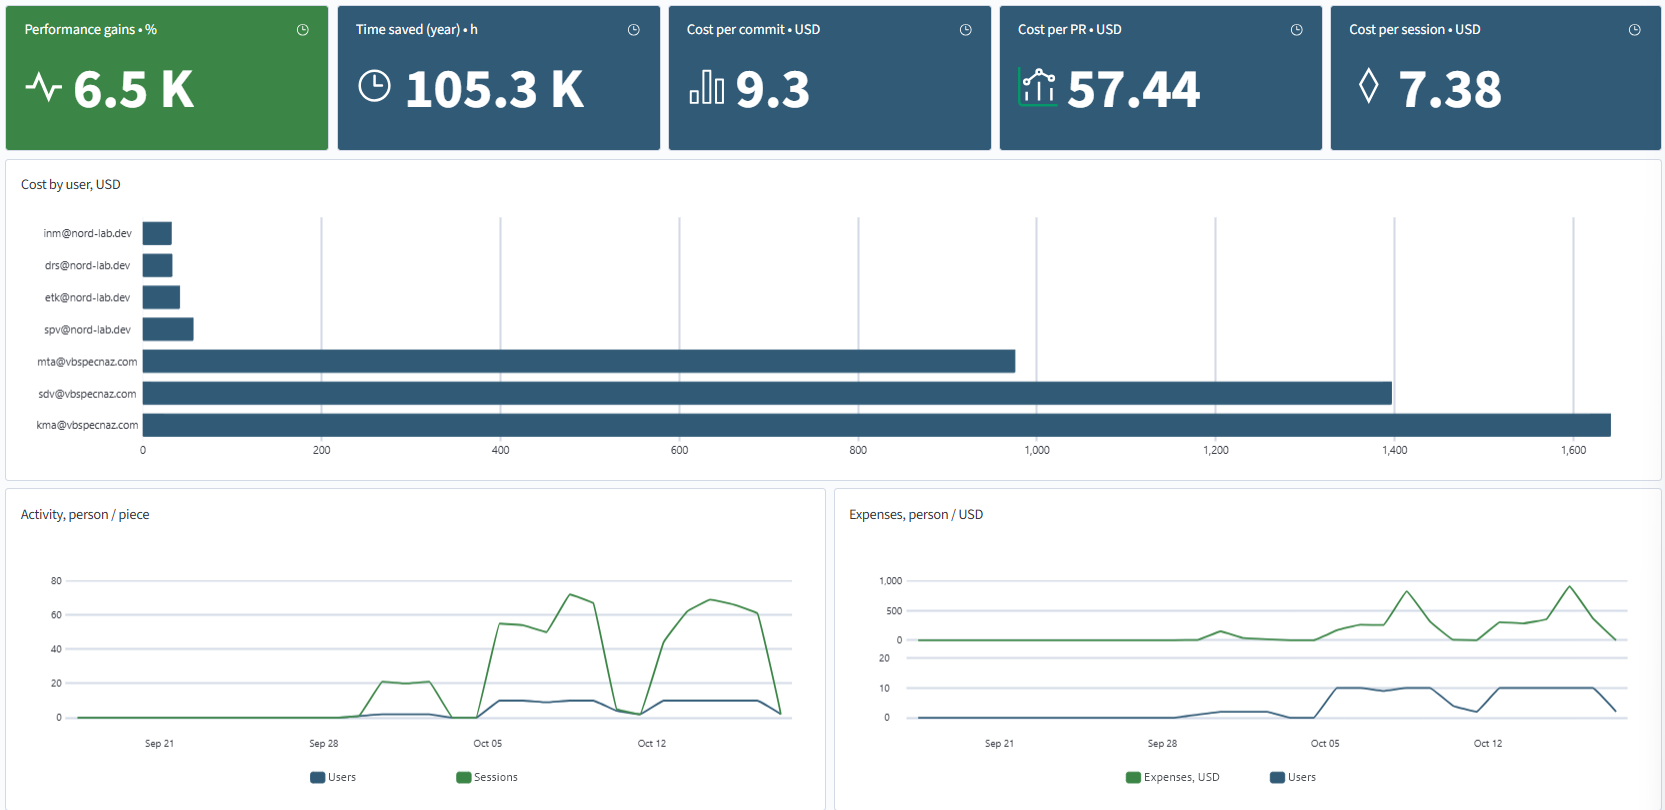
Shows the economic impact, cost per outcome, and changes in activity and spending over time:
- productivity gain and annual time saved
- cost per commit, PR, and session
- costs by member
- daily numbers of active members and sessions
- daily numbers of active members and spending
Productivity gain and time saved are estimates: the dashboard assigns two minutes of work to each added line of code and compares the result with active time in Claude Code.
6. Team
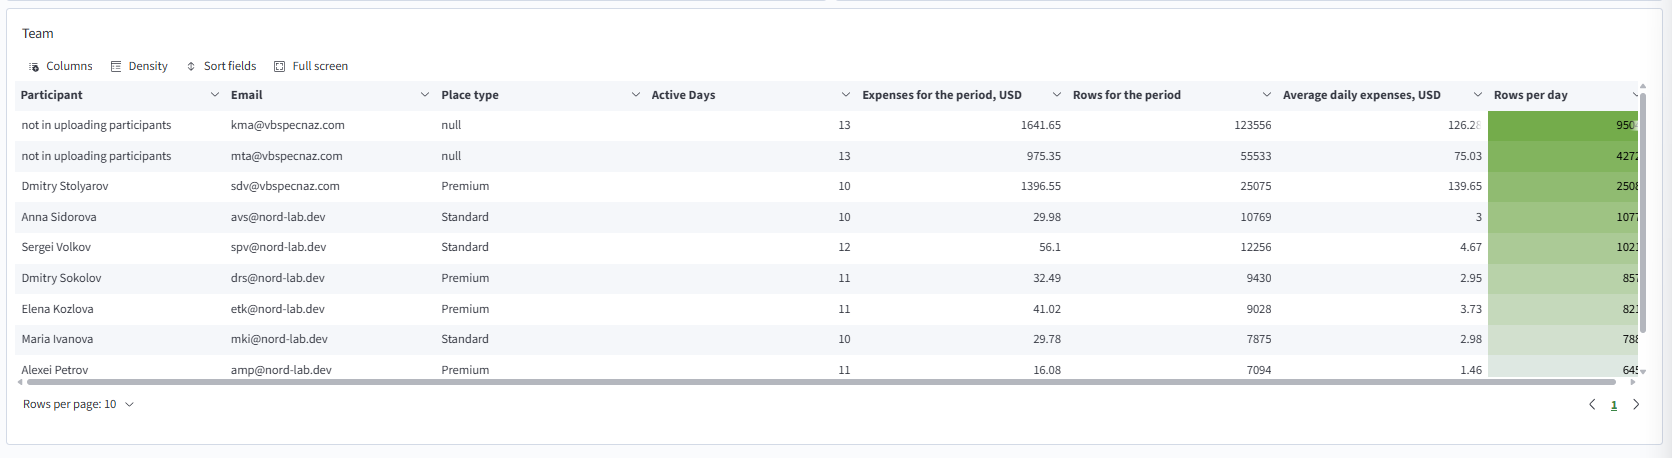
Shows a summary for each member: seat type, active days, spending and code lines for the period, and average daily spending and code lines.
Links to Other Dashboards
| Panel | Destination |
|---|---|
Team Productivity table | AI Observability: Claude Code - Member |