Launches Statistic
The Launches statistic page displays the launch history of a task: the status of each launch, execution time, search query and active action statistics.
To open the page, click any of the colored squares in the Launches statistic column of the task list. The launch corresponding to the selected square will be expanded automatically. You can return to the task list using the Back to the jobs list button in the upper right corner of the page.
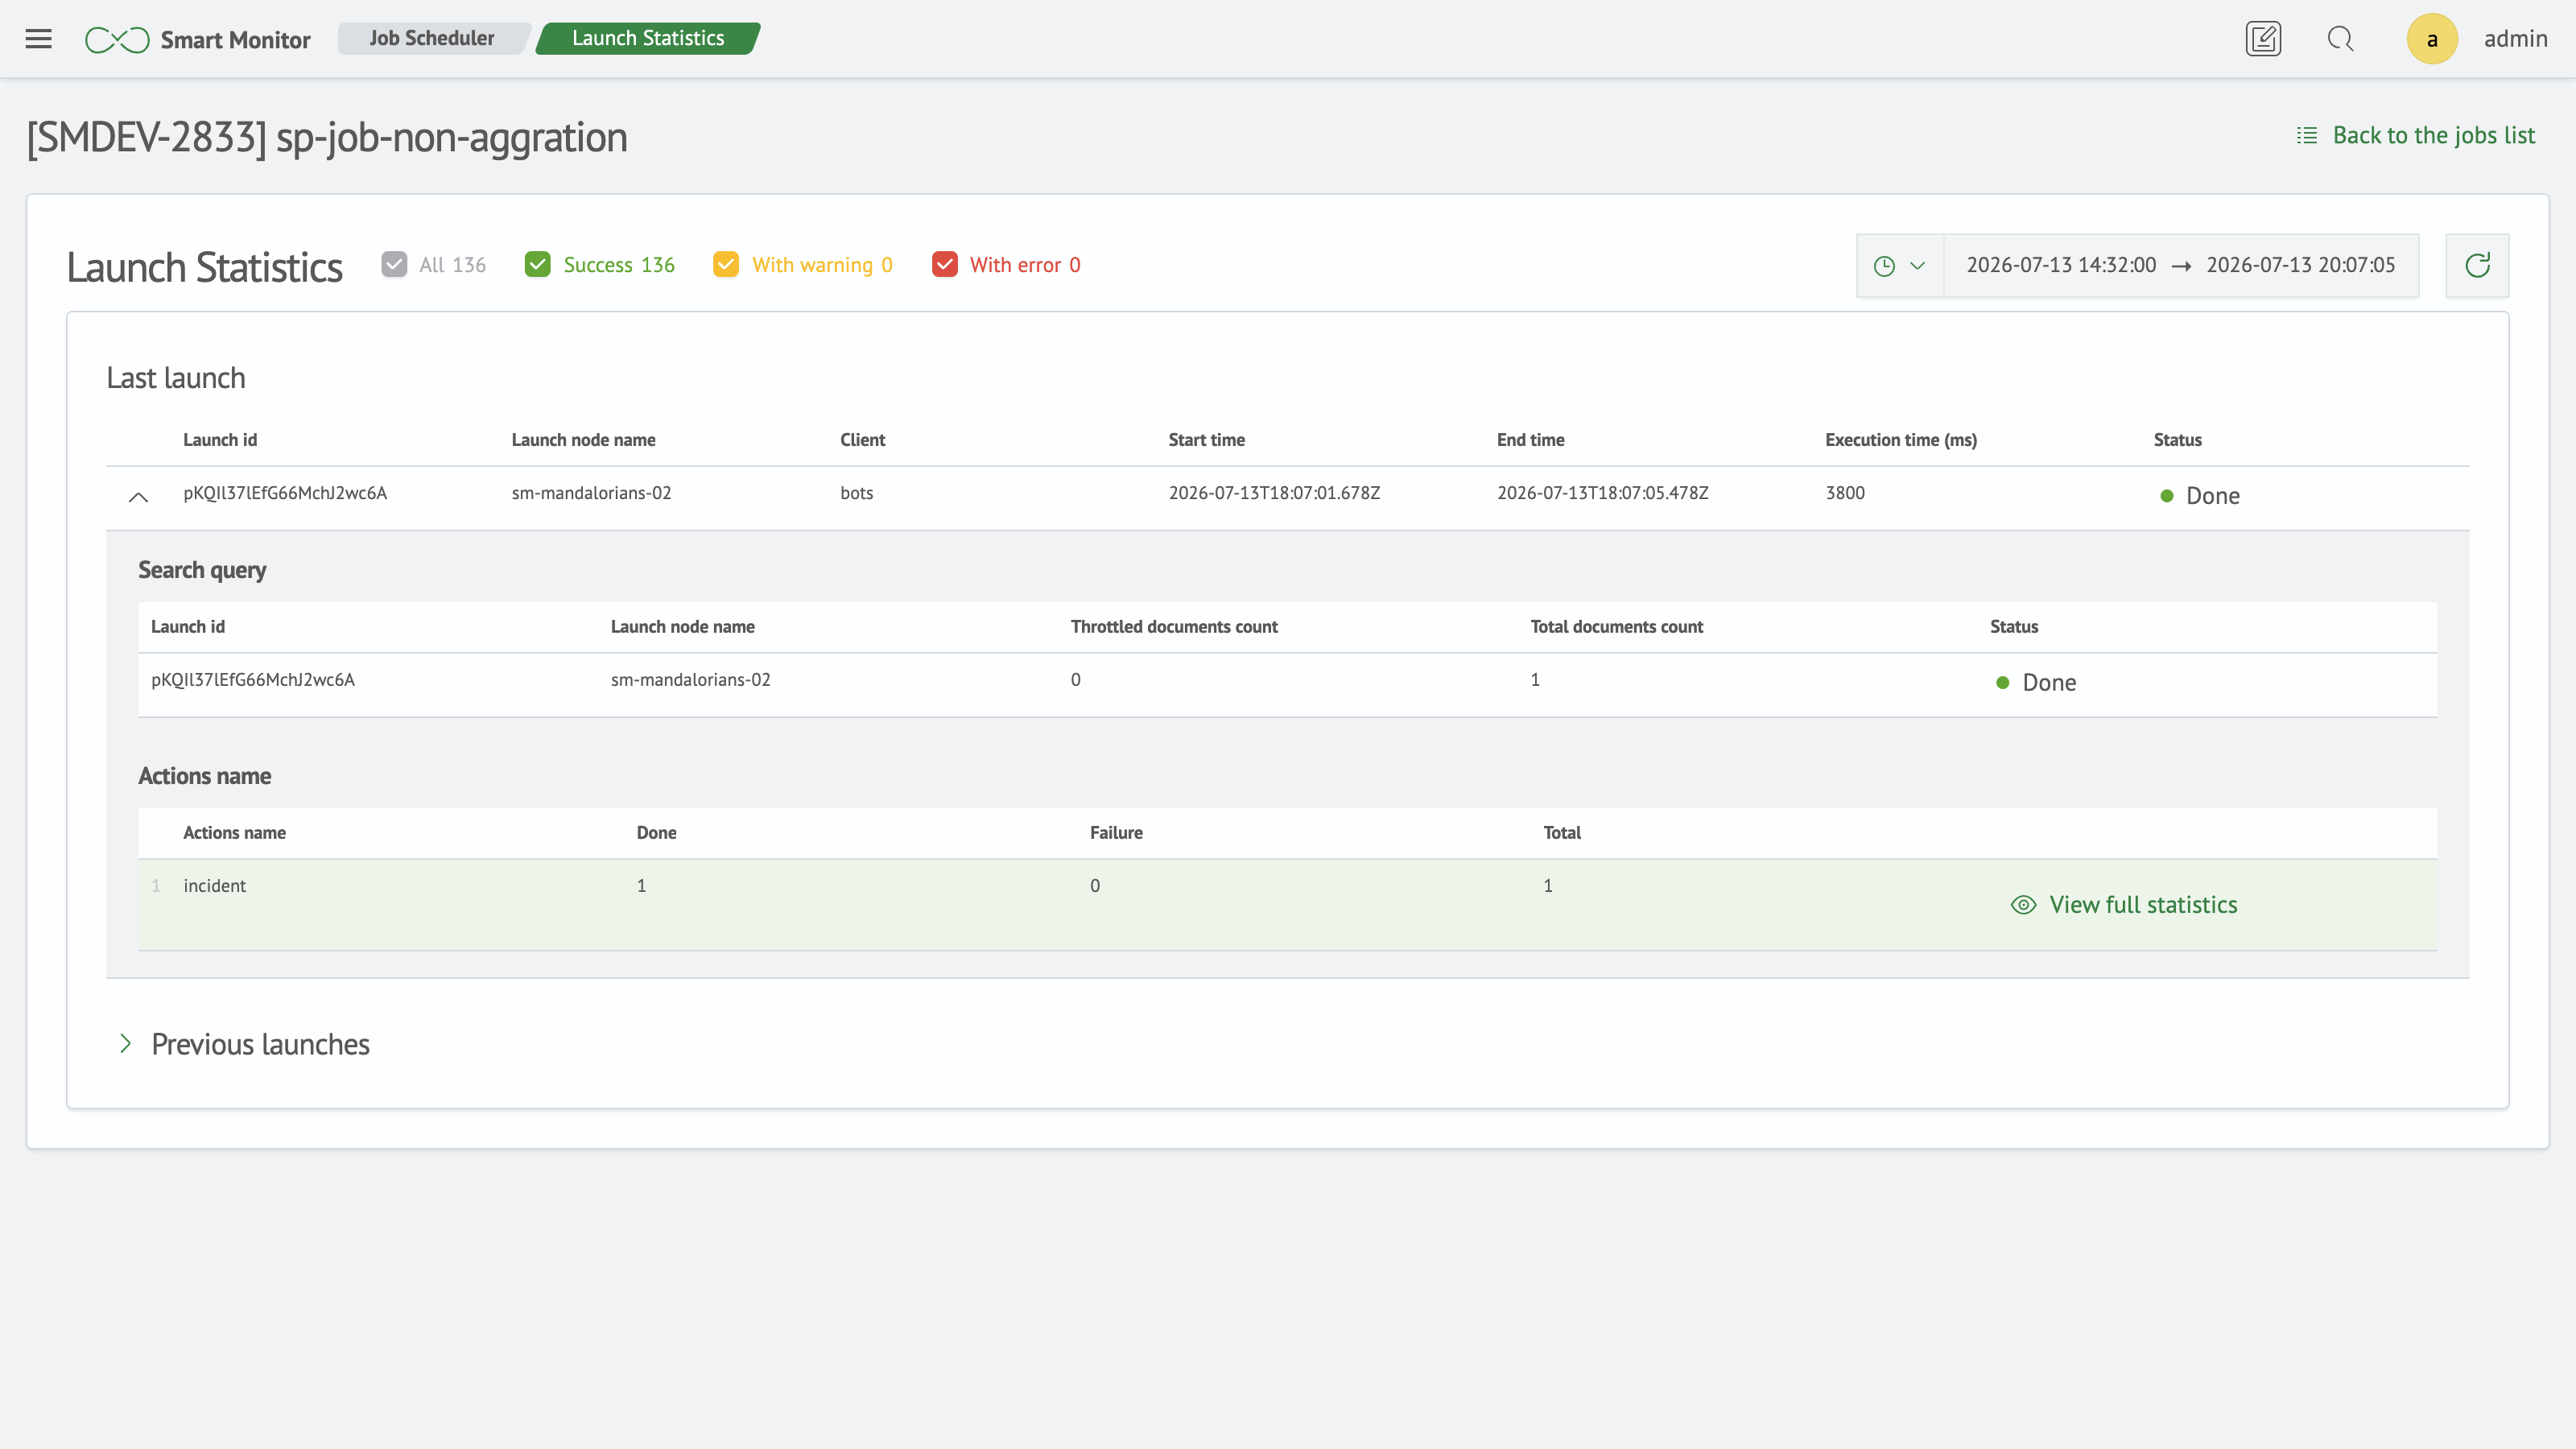
Filtering by Status
The upper part of the page contains counters of launches by status:
All- the total number of launches for the selected periodSuccess- launches completed without errorsWith warning- launches completed with a warningWith error- launches completed with an error
The counters also act as filters: uncheck a status to hide the corresponding launches from the table. The All checkbox enables or disables all statuses at once.
Selecting a Period
To the right of the counters there is a time range selector that defines the period for which launches are displayed. By default, the range covers all launches stored in the task statistics. The refresh button next to the selector re-requests the launch statistics.
Launch Tables
Launches are displayed in two tables:
Last launch- the most recent launch of the taskPrevious launches- the remaining launches for the selected period. The block is collapsible, and the table supports sorting and pagination
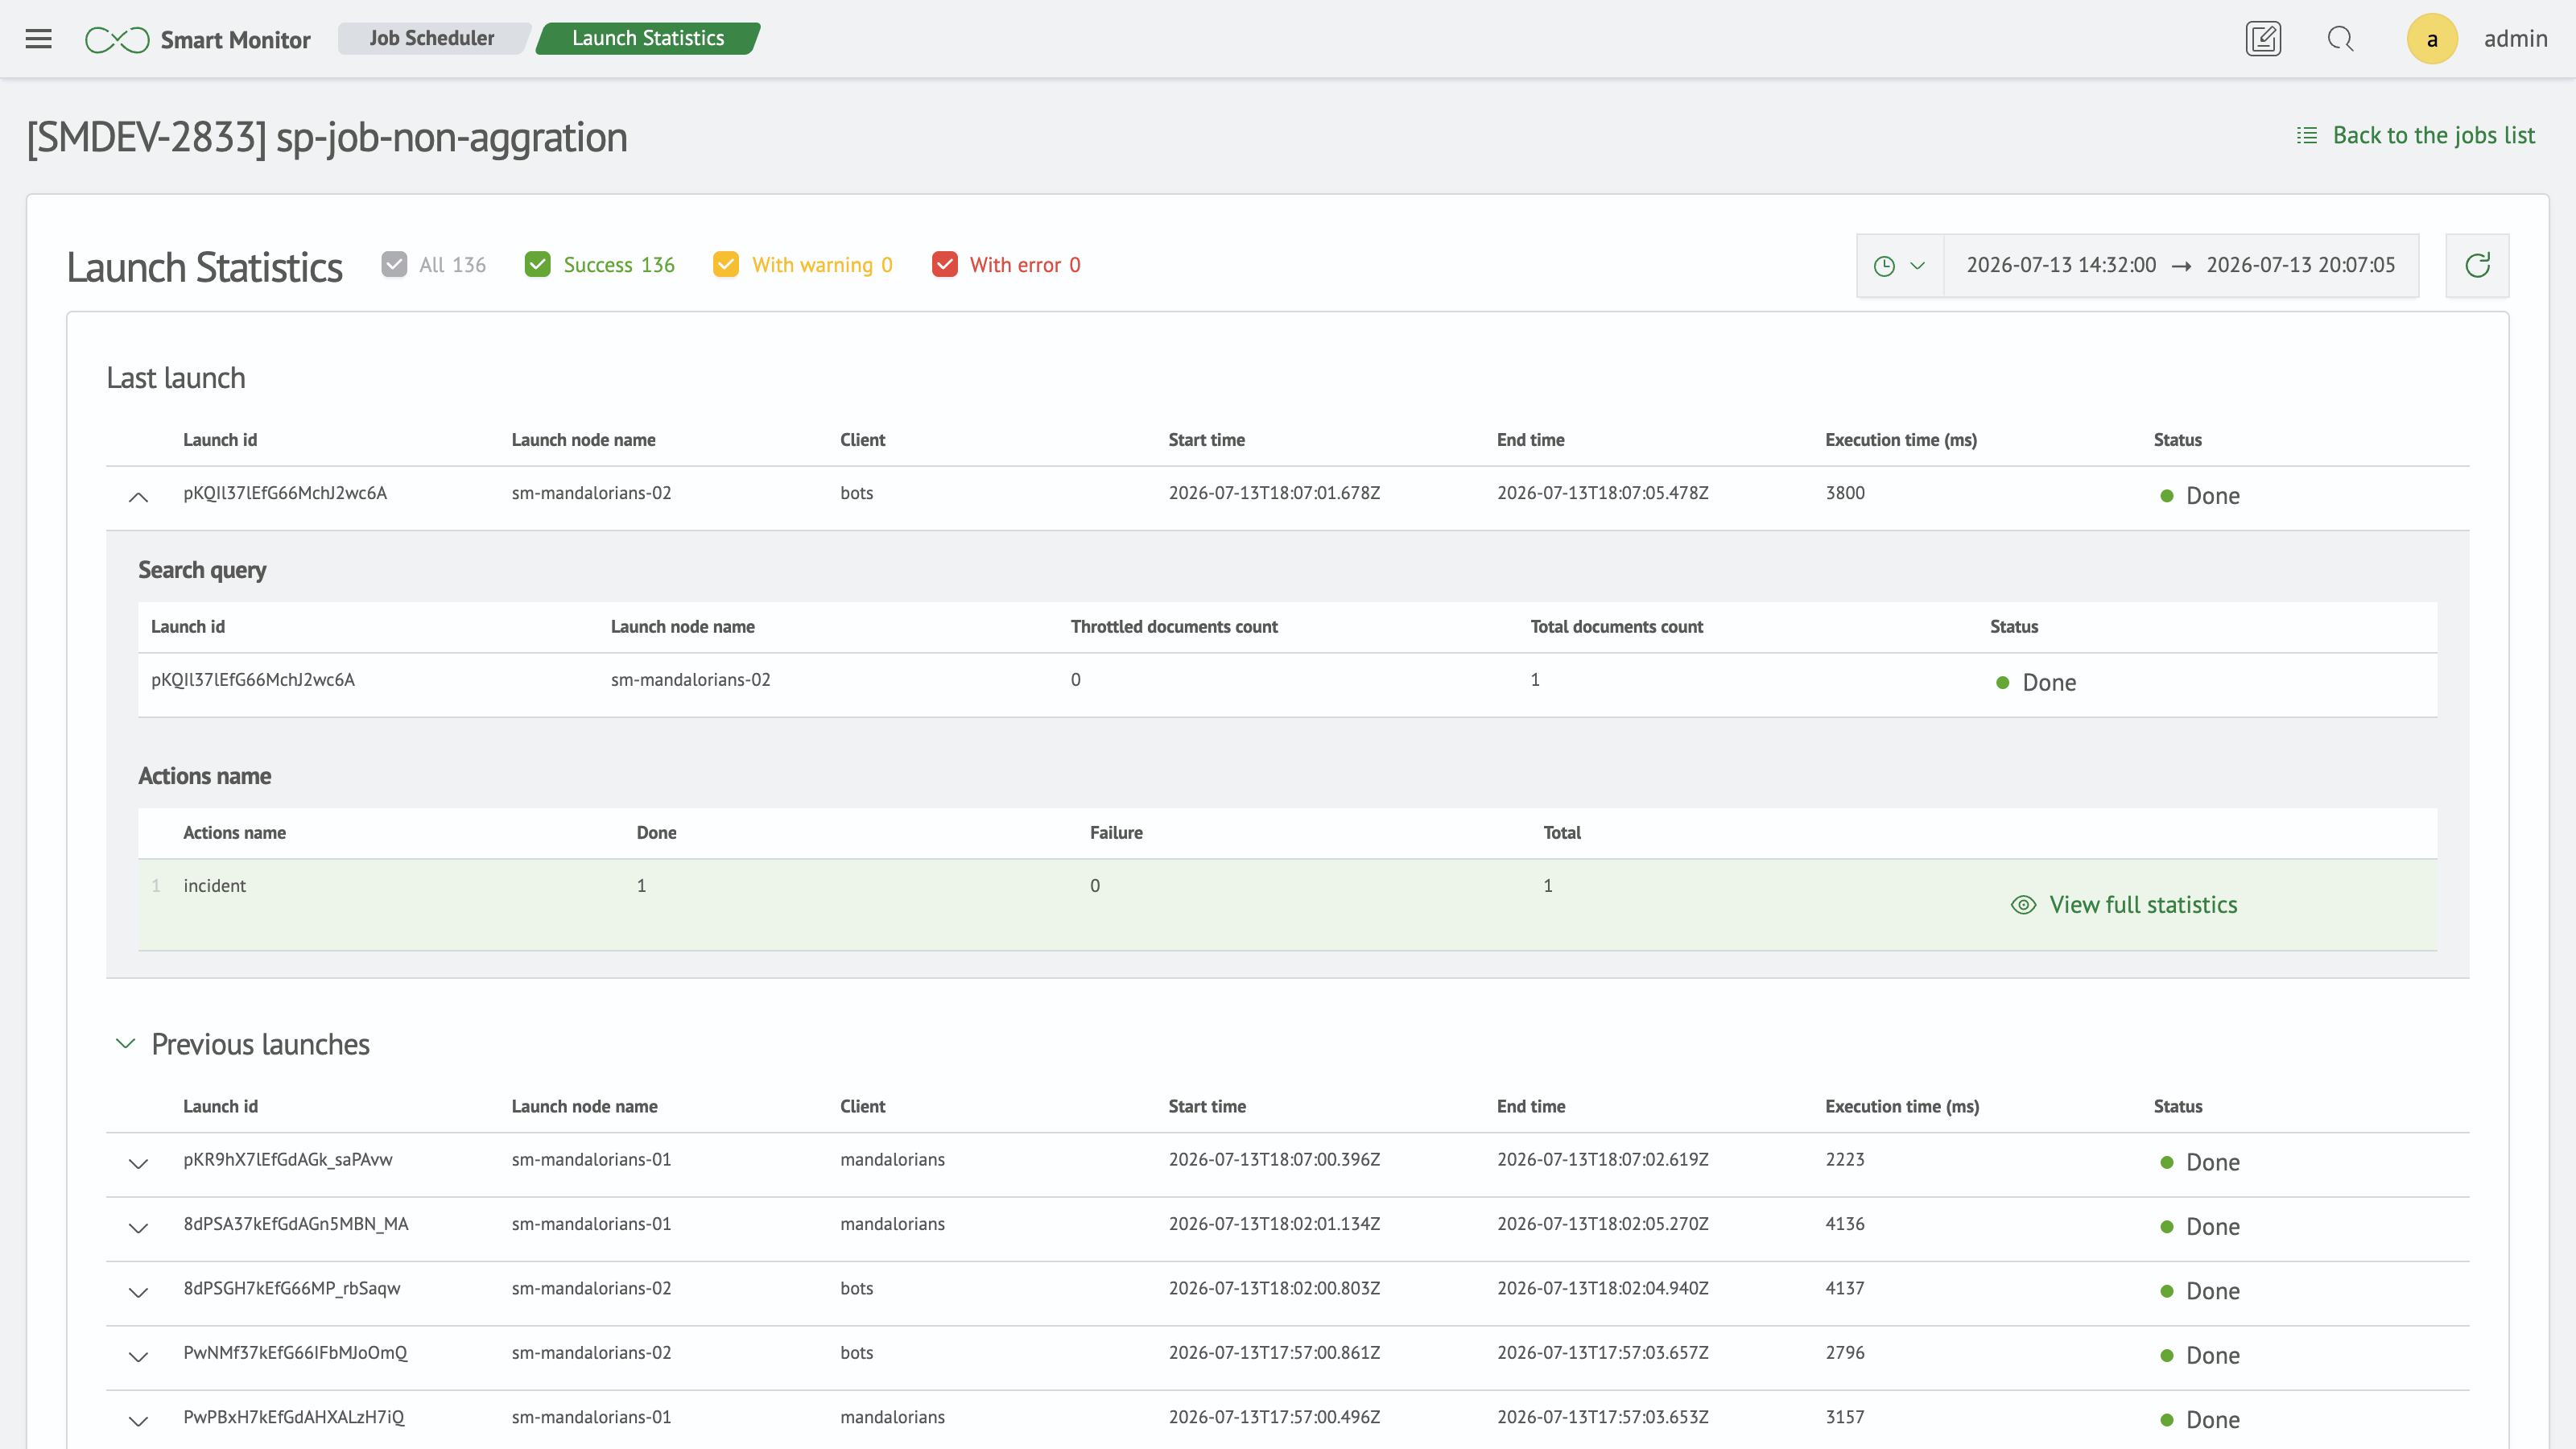
For each launch, the following is displayed: launch id, launch node name, start and end time, execution time in milliseconds, and status (Done, Warning, Error).
For SP tasks, the tables additionally display the Client column - the name of the SP client for which the launch was executed. Each launch of such a task for each client is displayed as a separate row.
For the Warning or Error status, the status name is a link - click it to open a window with the message text:

Launch Details
Click the arrow at the beginning of a launch row to expand its details. The details contain two tables:
Search query- statistics of the task's search query execution: the number of throttled documents, the total number of found documents, and the status. Clicking a row opens theSearchpage with the task's query in a new tabActive actions- statistics for each active action of the task: the number of completed (Done), failed (Failure), and total executions (Total)
The rows of the Active actions table are highlighted with color depending on the result: green - all executions completed successfully, red - all executions failed, yellow - there are both completed and failed executions.
The View full statistics button in an active action row opens the Statistics on active action launches page with the list of all executions of this action within the selected launch.