Metrics List
The metrics page displays a list of existing metrics:

The Create metric button in the upper-right corner opens the metric creation form. For more information, see
Metric configuration.
Until a metric is selected, the right side of the page displays the No metric selected placeholder with a prompt to
select a metric in the left panel.
Navigating the Metrics List
Use the Sort button to sort the list by metric name. Use the Search metrics field to find a metric by its name or
description.
Selecting the checkbox next to a metric adds it to the selection and opens the bulk actions panel below the list:
Enable- displayed if at least one selected metric is disabledDisable- displayed if at least one selected metric is enabledDelete- deletes the selected metrics
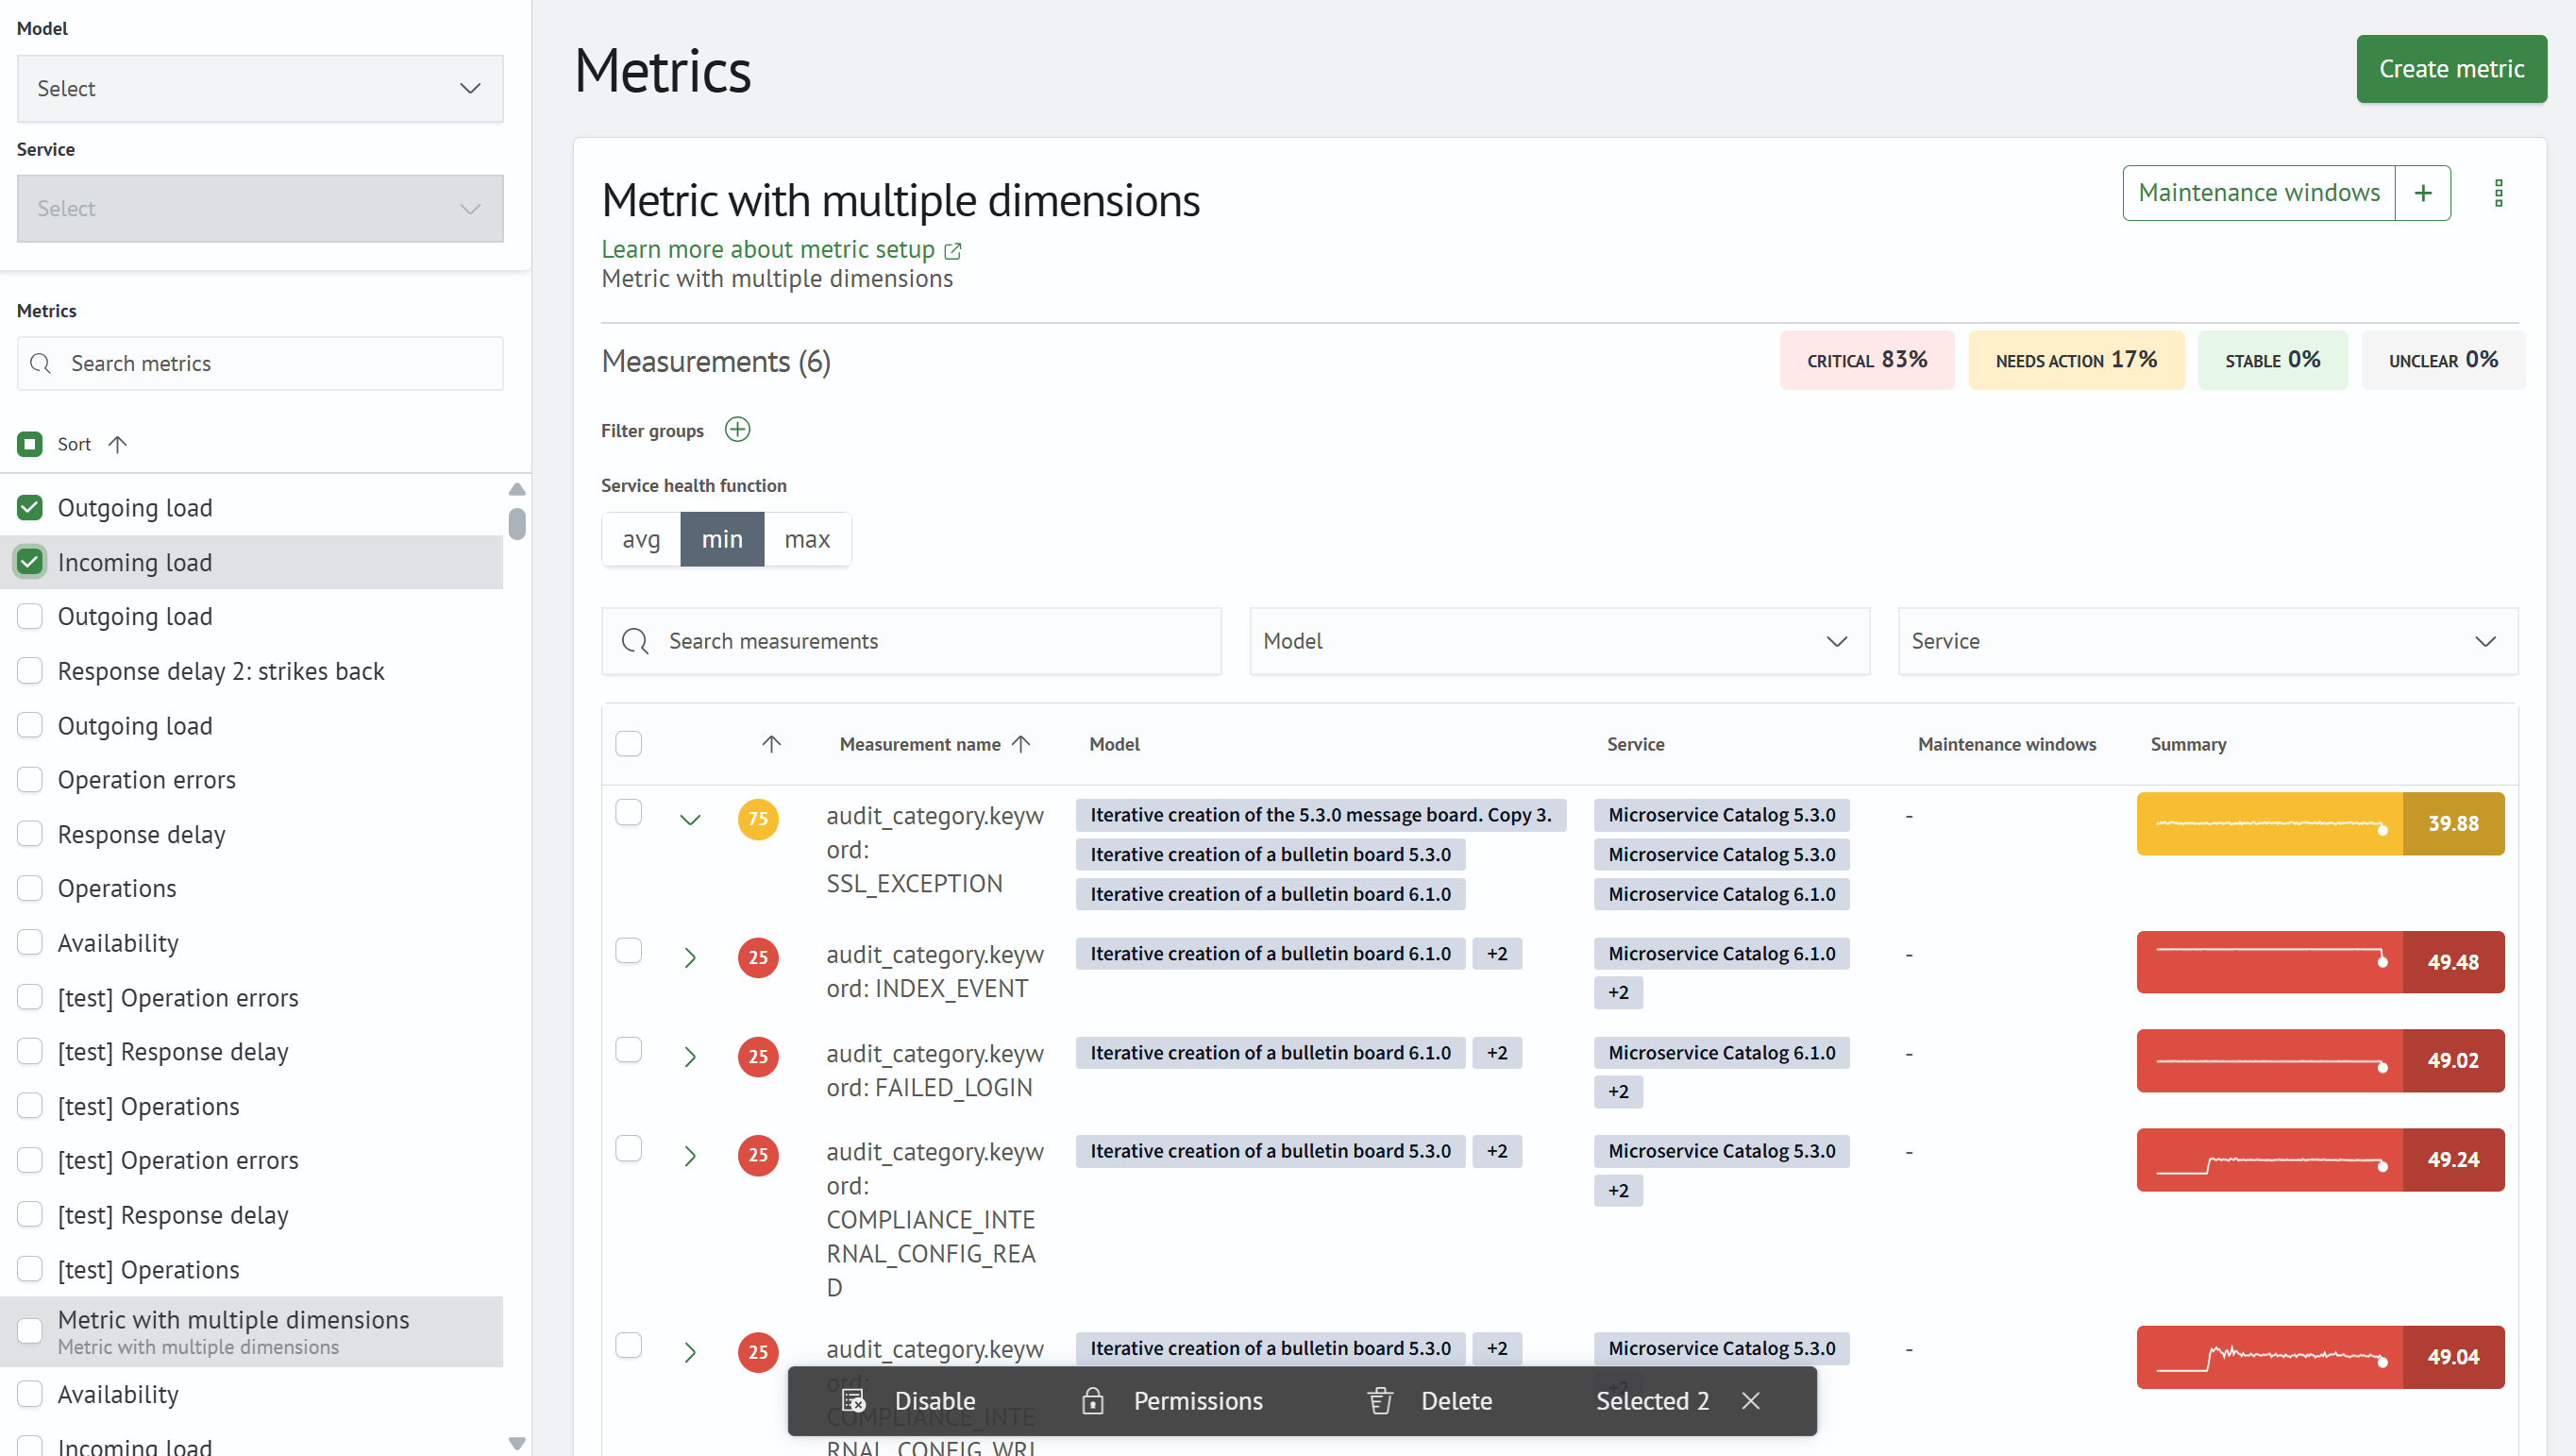
A checkbox only adds a metric to the selection; it does not open the metric. Click the metric name to view it. The checkbox in the list header selects or clears all filtered metrics at once.
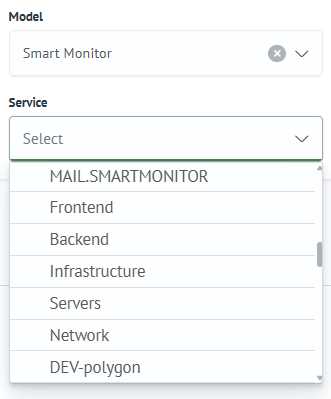
The Model and Service filters do not narrow the metrics list. They provide context for dimensions that are not
directly bound to a model or service: the dimension name and trend chart are displayed using the values selected in
these filters. The selected model is also used as the default when you open the dialog for binding dimensions to a
service. A service can be selected only after a model has been selected.
Metric Dimensions
Click a metric to view its dimensions:
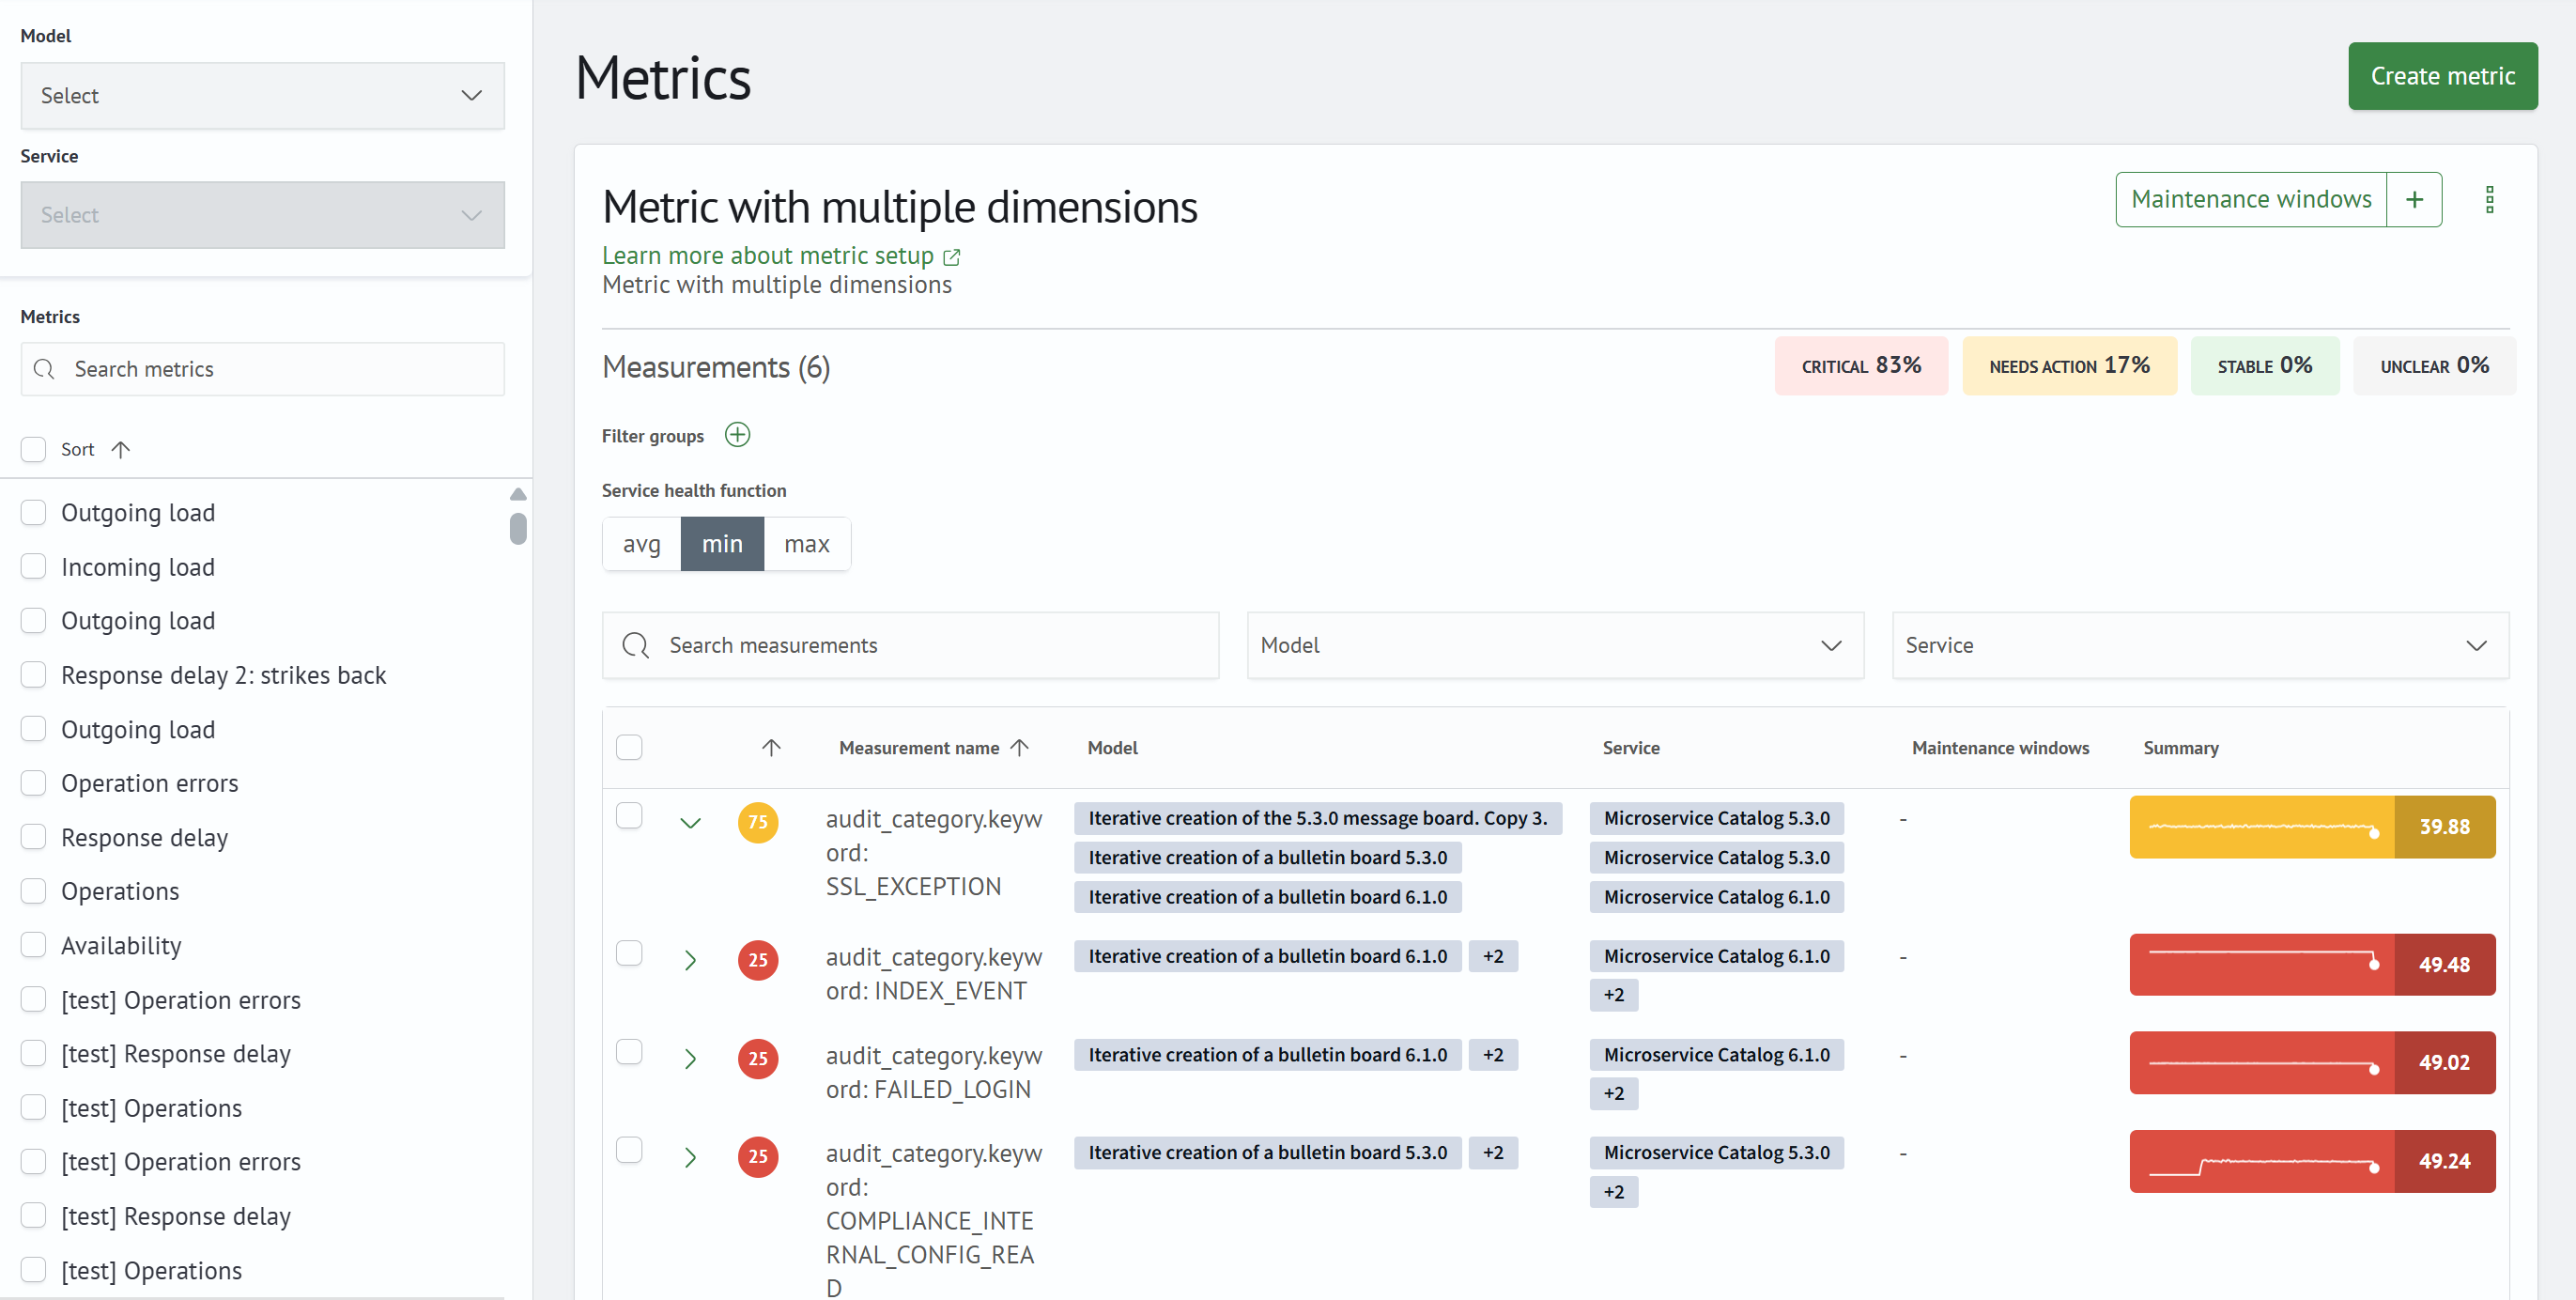
Metric dimensions are available only if dimension settings are configured in the metric parameters.
A training indicator may be displayed next to the metric name. It is available only for metrics that use an adaptive
model (Adaptive Metrics) and shows the status of the latest training run: Trained, Training, Warnings, or
Training error. Hover over the indicator to see the time of the latest training run. Click the indicator to open the
metric's adaptive model page.
The Maintenance windows button opens the list of maintenance windows associated with the metric. Click the +
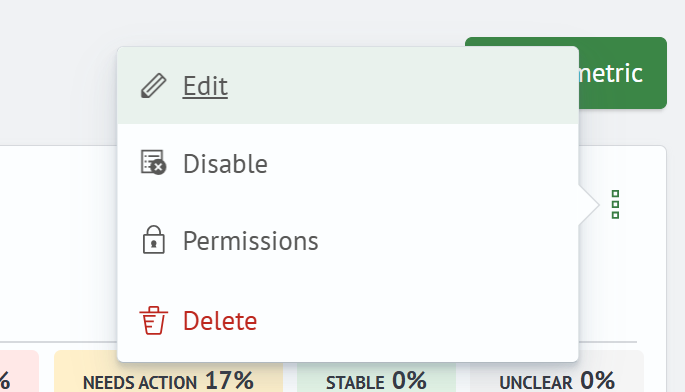
button next to it to create a maintenance window. The three-dot menu provides the following actions for the current
metric:
Edit- opens the metric editing pageEnable/Disable- enables or disables data collection for the metricDelete- deletes the metric
The Measurements (N) counter shows the number of metric dimensions. Next to it, the dimensions are grouped by
status: CRITICAL, NEEDS ACTION, STABLE, and UNCLEAR.
For each dimension, the Model and Service columns show the associated objects. In a collapsed row, one object and a
+N counter for the remaining objects are displayed. Expand the row using the arrow at the beginning of the row to
view the complete list. The Maintenance windows column follows the same pattern and shows the maintenance period and
status: Active, Completed, Planned, or Cancelled. A collapsed row shows only the dimension's latest maintenance
window; an expanded row shows the complete history. If a dimension has no associated objects or maintenance windows,
the corresponding column displays -.
Binding Dimensions
If a metric has dimensions, you can select them for binding to a service in the following ways:
- select their checkboxes in the dimensions list
- configure a filter group using
field-valueconditions
When you enter and apply a filter group, the dimensions list is visually filtered. Filter conditions support the *
wildcard character, for example, db-*.
Dimensions selected using checkboxes are pinned to the top of the list and remain selected when a filter group is applied. Both dimensions selected using checkboxes and dimensions matched by the filter group are bound to the service. For example, you can manually select specific dimensions and also configure a filter group; both sets of dimensions will be bound. The counter below the table separately shows the number of selected dimensions and the number of dimensions matched by the filter group:
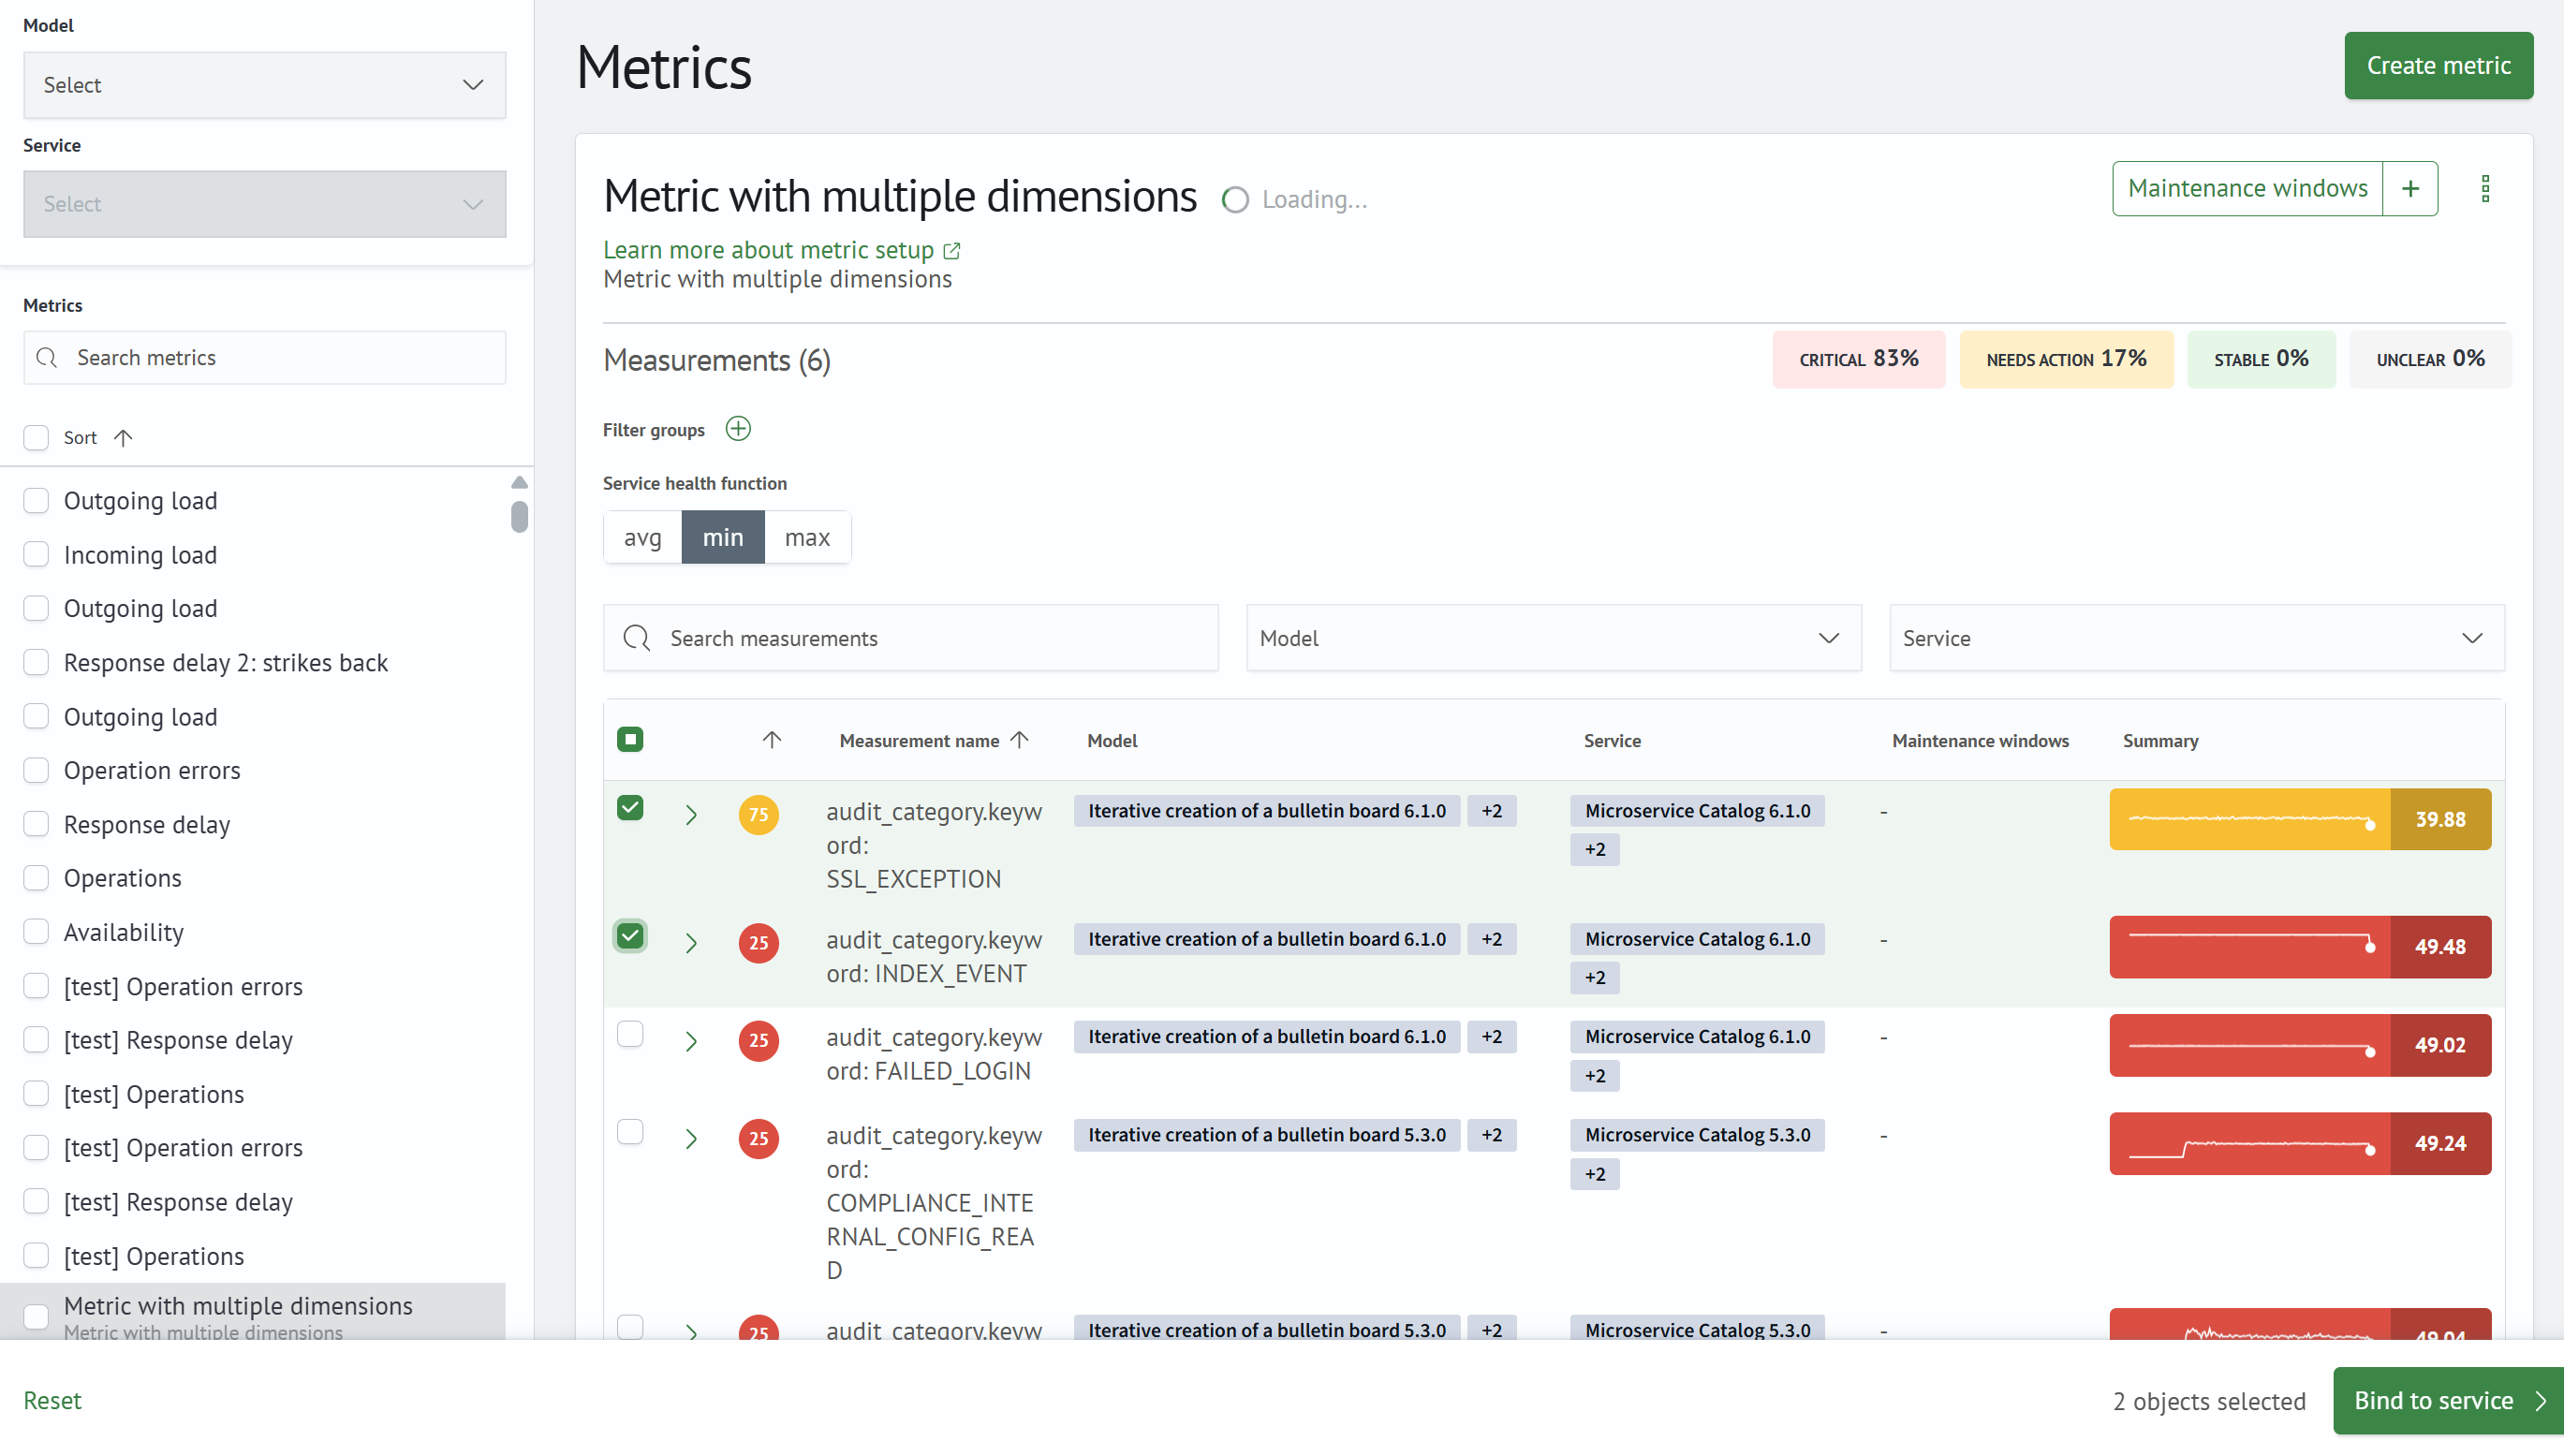
You can save a binding without selecting any checkboxes, for example, when the selection is defined only by a filter group.
You must also specify the Service health function. It determines how the service state is aggregated across all
selected dimensions. The following values are available:
avgminmax
The Bind to service button appears and opens the service selection page:

Select a service and click Set impact to complete the configuration. Configure the impact of the new service
metric if necessary.