Single Value
Overview
Single Value is a type of data visualization that focuses on displaying and emphasizing a single numeric value or metric. This approach to data visualization is particularly effective in situations where a specific metric needs to be presented quickly and clearly. Using a metric allows you to focus on one key indicator, minimizing noise and allowing users to quickly understand key trends or achievements.
One of the benefits of using a metric is its simplicity and clarity. Visualizing a single numeric value is usually done with a simple representation of the number and additional displays such as, a graph of the change in value, a trend, and a trend graph.
Settings Single Value
Settings

Single Value has the following set of parameters in the Settings tab:
| Parameter | Description | JSON Field |
|---|---|---|
| Metric Label | Optional field that controls the metric name - text that is displayed under the value. Dashboard token values can be substituted. | general.label |
| Value | Required field that controls the displayed metric value (column from query results). | general.fieldForValue |
| Align to center | Checkbox controls column content alignment: when enabled, values are centered (default value), when disabled - left-aligned. | general.isCentered |
| Type of value | Switch for selecting the displayed value type. Numeric type is set by default. Affects field display method: when numeric type is selected, parameters Delimiter, Units of measurement, Shorten large numbers become available, as well as trend fields and Show Trend option. In the String option, numeric type parameters are unavailable, but in the Display section, color setting by specific value instead of range becomes available. | general.valueType |
| Delimiter | Allows selecting a delimiter symbol for formatting numbers with thousand separators (dot, space, or comma). For example, with number 1234567 and selected comma, result will be 1,234,567. Works only for numeric values | show.delimiter |
| Units of measurement | Allows entering units of measurement that will be displayed next to visualization name with dot (for example: Name • pcs). Works only for numeric values | show.suffix |
| Shorten large numbers | Converts large numbers to more readable format with abbreviated units (for example, 1500 → "1.5K", 2000000 → "2M"). Works only for numeric values | general.shortenBigNumbers |
| Icon | Allows adding an icon before the main visualization value | icon |
| Field for trend | Optional field responsible for displaying metric trend change. | general.fieldForTrend |
| Trend Unit Selection Field | Defines trend display units - in percentages or in units. | general.trendUnit |
| Show Trend Sparkline | Enables or disables trend graph display for visualization. Works only for numeric values | show.sparkline |
These parameters are applied to the visualization as follows:

- Metric Label (
label) - Units of measurement (
suffix) - Trend indicator (depends on
fieldForTrend,trendUnit) - Icon - image before value (
icon) - Trend - displayed graph (depends on
valueTypeandsparkline) - Main value (
fieldForValue) - Delimiter (
delimiter) - Abbreviated suffix for large number transformation (
shortenBigNumbers)
Display

Single Value has the following set of parameters in the Display tab:
| Parameter | Description | JSON Field |
|---|---|---|
| Color Settings | Allows selecting what color settings apply to - value or trend | color.isRange |
| Color Palette Field | Allows setting a set of color rules - by ranges for numeric values or by specific values for strings. Works only in Value mode | color.color |
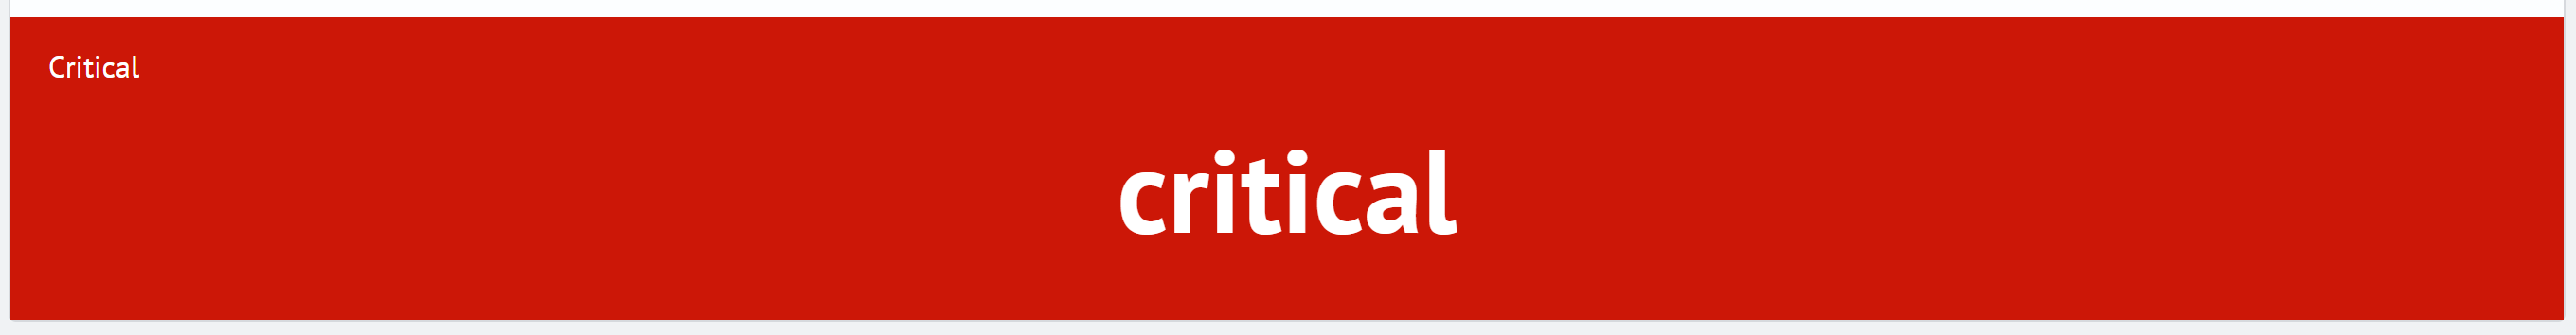
| Object | Defines what gets colored when condition matches: background or value. Works only in Value mode | color.invert |
| Direction Color | Defines color scheme of trend indicators. Classic is applied by default. Reverse trend palette works only in Trend mode | color.indicatorColor |
The color palette type in Color Palette Setting Field depends on the Value Type parameter (in the Settings tab):
- Numeric — color is set by value ranges
- String — color is set by specific values (exact string match)
To set color by specific value, you need to switch Value Type → String.
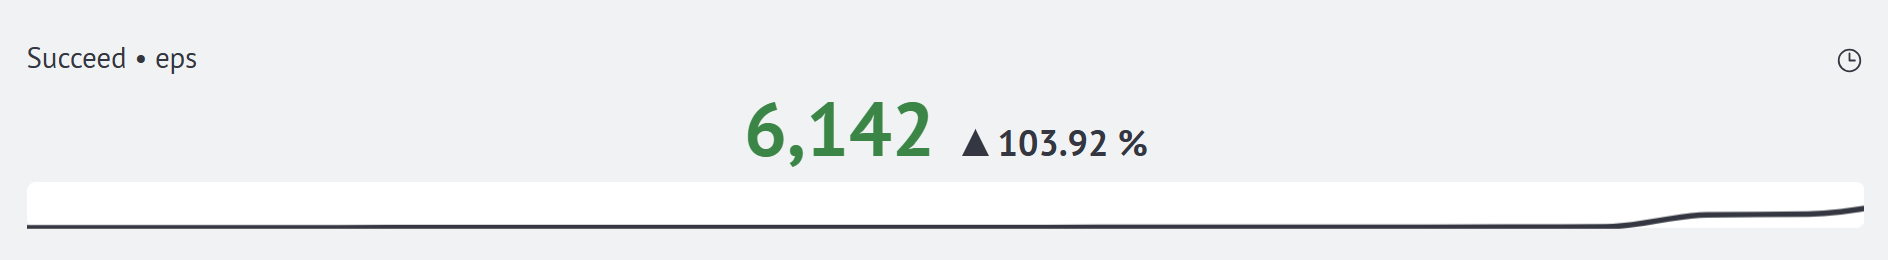
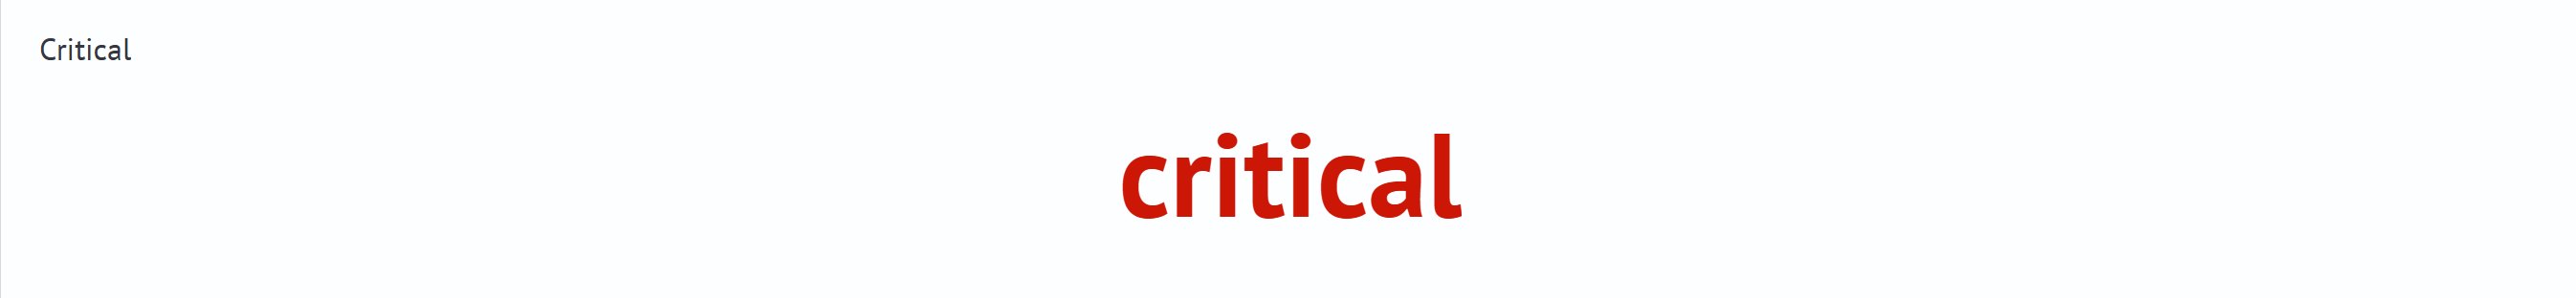
Display in Value mode
Display in Value mode (string type)
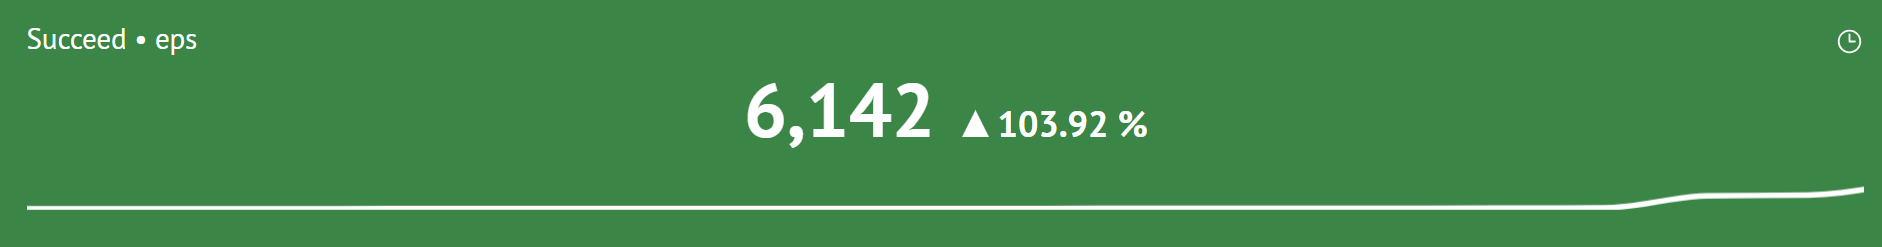
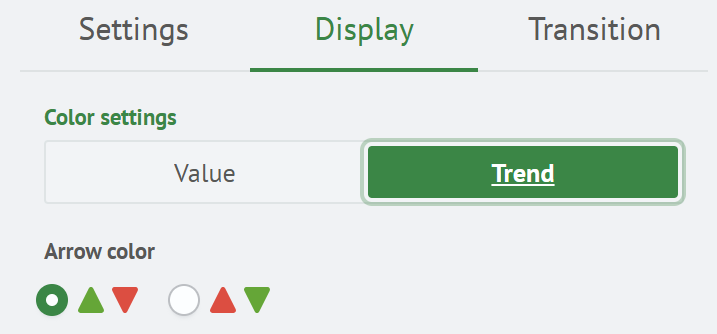
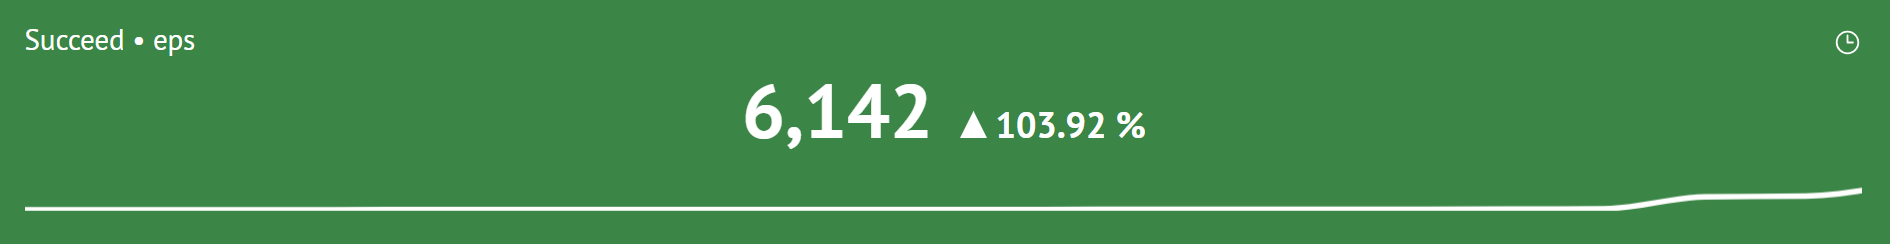
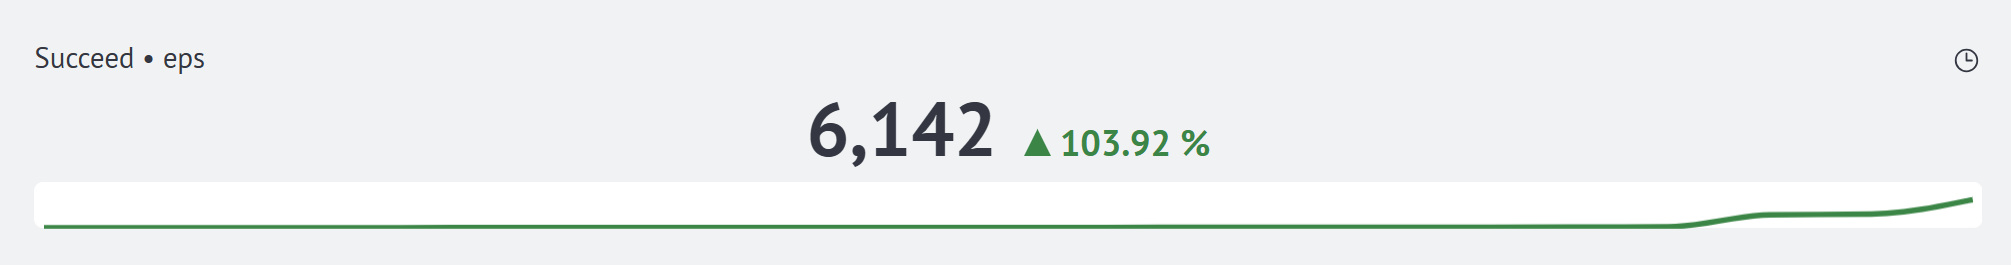
Display in Trend mode (default and reverse palette)
Transition


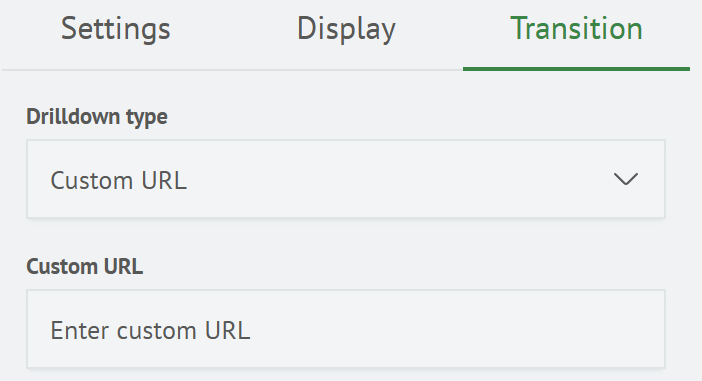
Single Value has the following set of parameters in the Transition tab:
| Parameter | Description | JSON Field |
|---|---|---|
| Link Type | Allows selecting type from list: Search, Arbitrary Link and Token Change. Determines visualization behavior when clicked. Available options: Search - when search query exists on visualization card, link icon is displayed in upper right corner. When clicking anywhere on card, transition to search page occurs, with search bar automatically filled with specified query. Arbitrary Link - when custom URL is specified, link icon is displayed. Clicking transitions to given address. Token Change - when clicking, dashboard token values are changed. | drilldown.drilldownType |
| Search | Fields for specifying search query. Works only in search mode | drilldown.drilldownQuery |
| Time Filter | Allows selecting and configuring time interval filter. Works only in search mode | drilldown.drilldownSelectTimeToken |
| Arbitrary Link | Field for specifying custom link Works only in arbitrary link mode | drilldown.drilldownText |
| Add Token | Allows setting dashboard token list and their values. Each token is specified as name-value pair. Works only in token change mode | drilldown.drilldownTokens |
These parameters are applied to the visualization as follows:


When hovering over link icon, a tooltip appears containing full link text or search query.
Creating a Single Value
To create this type of visualization, use a query that returns an aggregation. This can be a count of some values, sum, count of unique values, etc. Smart Monitor provides several aggregating commands. For Single Value type, stats is considered.
source winlog_auth*
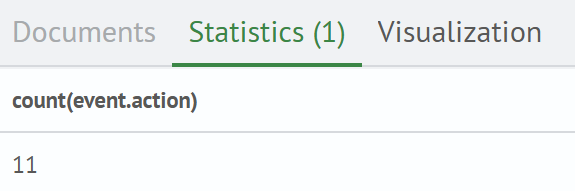
| stats count(event.action)
After executing this query in the Statistics tab, the following result will be obtained:
If you go to the Visualization tab. By default (if query doesn't use timeaggs and timechart), you'll see Table View visualization:

In the first dropdown list, select Metric. After changing the parameter, an empty rectangle will be displayed because parameters aren't configured. Below, specify the required Value Field parameter, select field from dropdown list, for example: count(event.action). Result will be:


Now this visualization can be added to dashboard by creating new one or selecting existing. Click Add to Dashboard button and fill modal window:

Then click Save button. Visualization is created and added.