Token Management
The drilldown function allows updating token values and running dynamic actions on the current dashboard. Instead of navigating to another search or dashboard, drilldown can control token values when a user clicks on a panel element.
Depending on the panel configuration, changing token values can lead to various dynamic changes in its behavior.
Operating Principle
Managing token values is a key element in creating interactive dashboard behavior using the drilldown function. Before configuring token value updates, it is necessary to plan the desired panel behavior. For example, content can be shown or hidden by user click. It is also possible to set a token value that is part of a search query to form a more detailed visualization on the panel.
In drilldown, token values can be set or changed by user click. However, changing token values alone does not lead to dynamic panel behavior. To ensure interactivity, it is necessary to configure panel elements to respond to these token updates.
Configuration Steps
- On the dashboard where drilldown needs to be configured, click
Edit - Select the panel where drilldown is being configured and click the settings icon
- Select the link type
Token Change
- Configure the required list of used tokens
- Click
Apply Settingsto apply the drilldown - Add a
TextorChoicefilter by clickingAdd Filter, then move the filter to the panel that will appear when selecting a value from the source panel's column - Configure the filter by adding the same name in
System Nameas the token name in step 4 - Click
Saveto apply filter settings - Click
Saveto save changes to the dashboard
Token Usage Examples
$row.columnName$ — table cell value
The $row.columnName$ token captures the value from a table cell when clicking on a row. columnName is replaced with the column name in the query results.
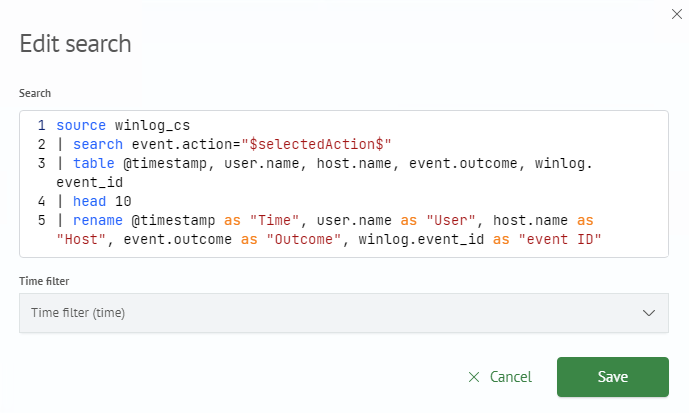
In the example, the Action Statistics table contains a Action column. When clicking on a row, the $row.Action$ token gets the value from this column and passes it to the dependent Events by Action table.
Main table query:
Drilldown configuration — type Token Change:
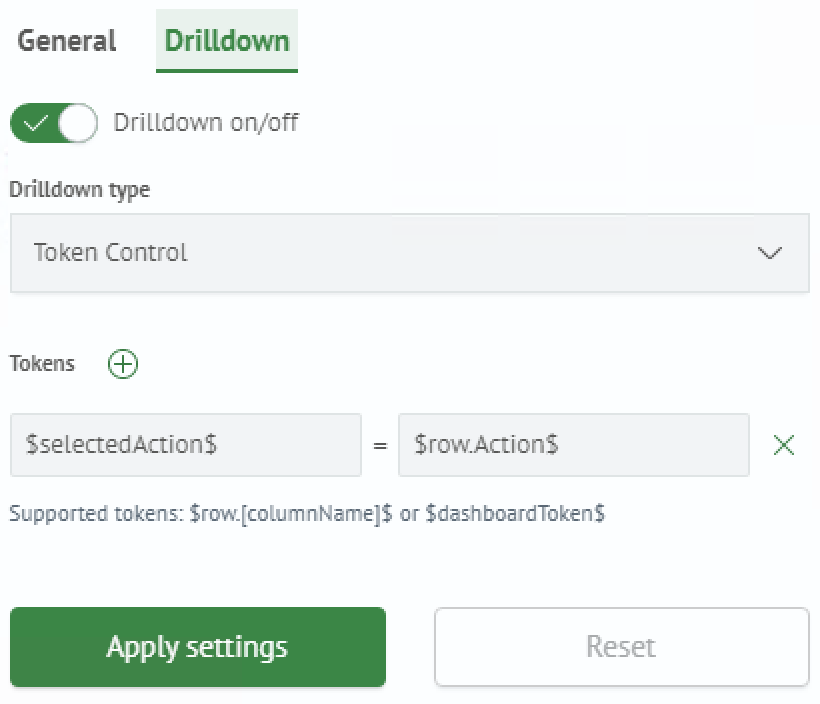
In the Token Name field, an arbitrary name is specified, for example $selectedAction$. In the Token Value field — $row.Action$.
Dependent table query uses the token in the filtering condition:
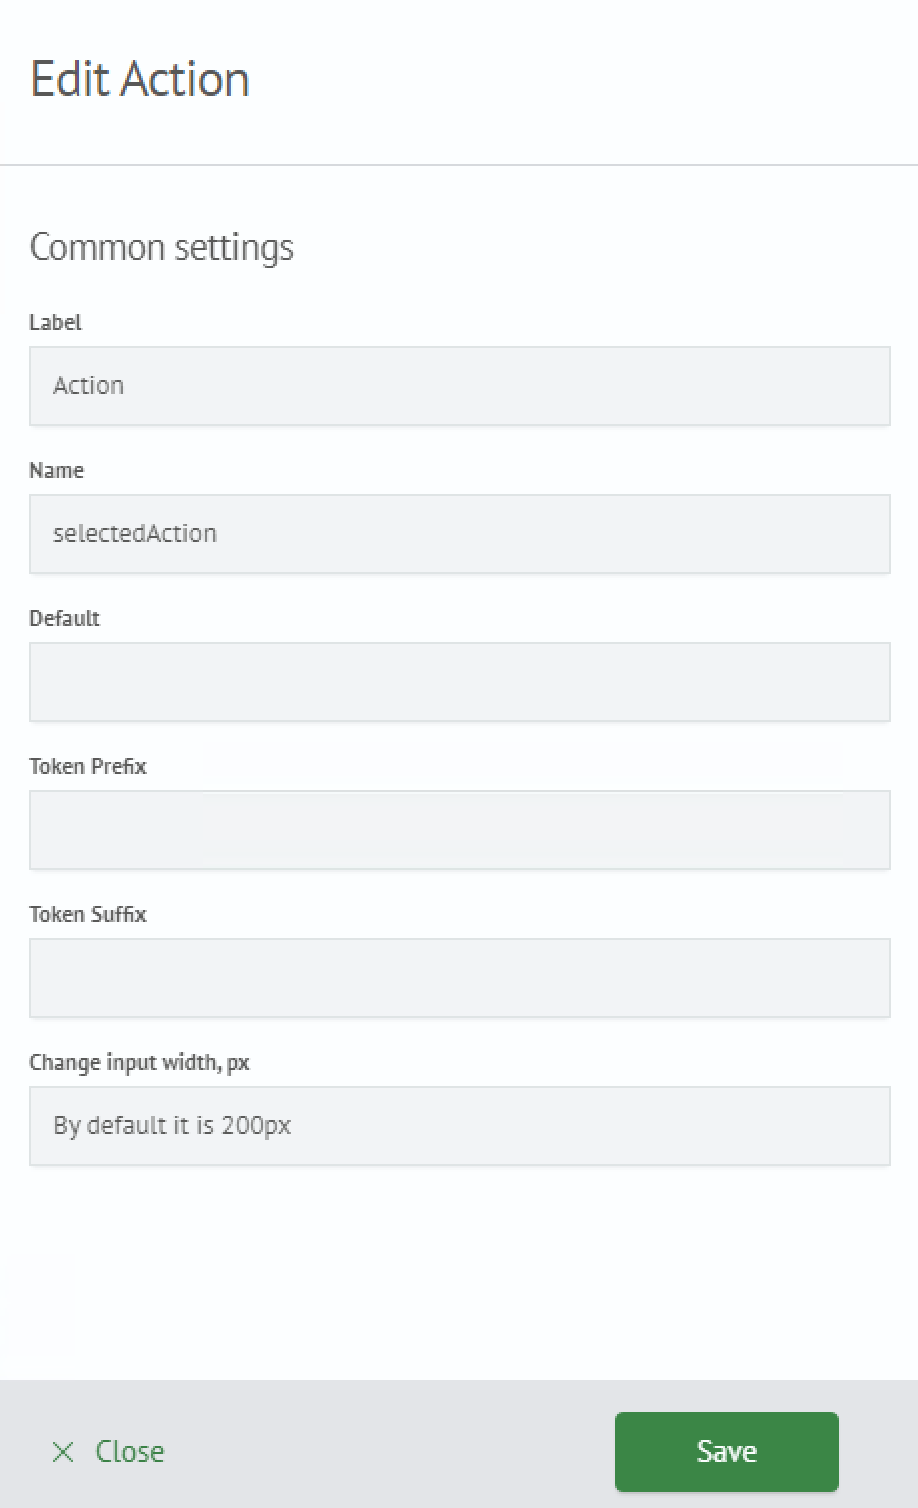
The dependent panel is hidden until clicked due to the depends: ["$selectedAction$"] attribute in the panel's JSON editor.
Result — clicking on a row expands the detailed table:

$click.value[X|Y]$ — chart axis value
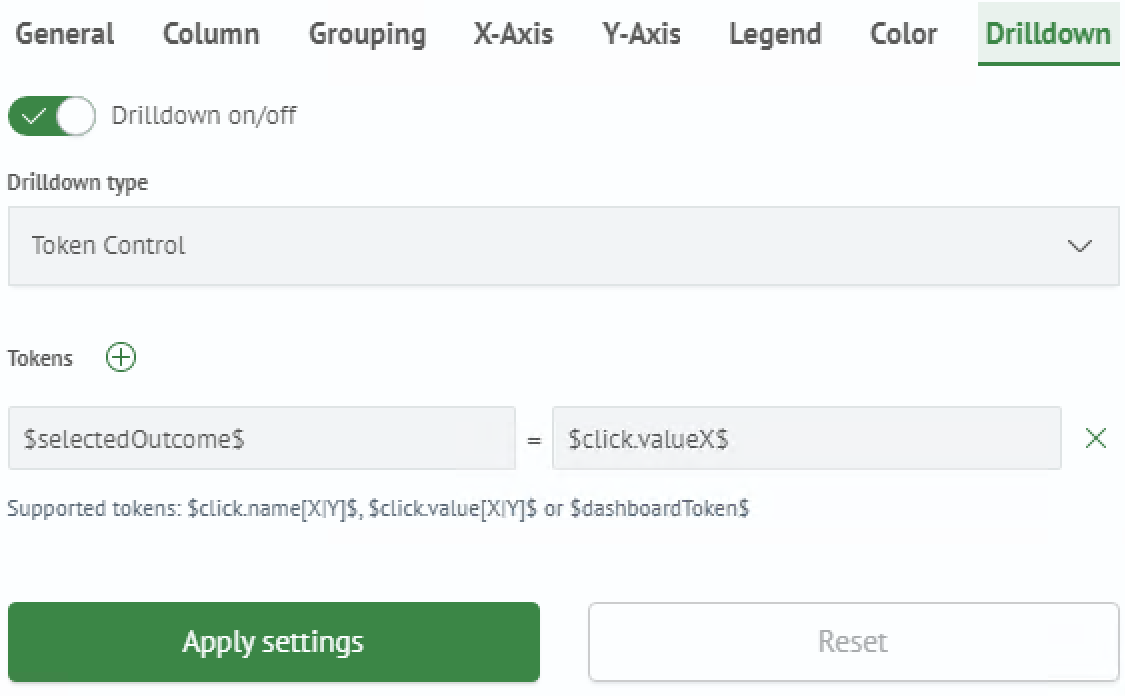
The $click.valueX$ token captures the value on the X-axis at the click point, $click.valueY$ — on the Y-axis. Applied to bar, pie, and line charts.
In the example, the bar chart Distribution by Outcomes displays the number of events by event.outcome field values. When clicking on a bar, the $click.valueX$ token gets the outcome value (success or failure).
Visualization:

Drilldown configuration:
Dependent table query filters events by the selected value:
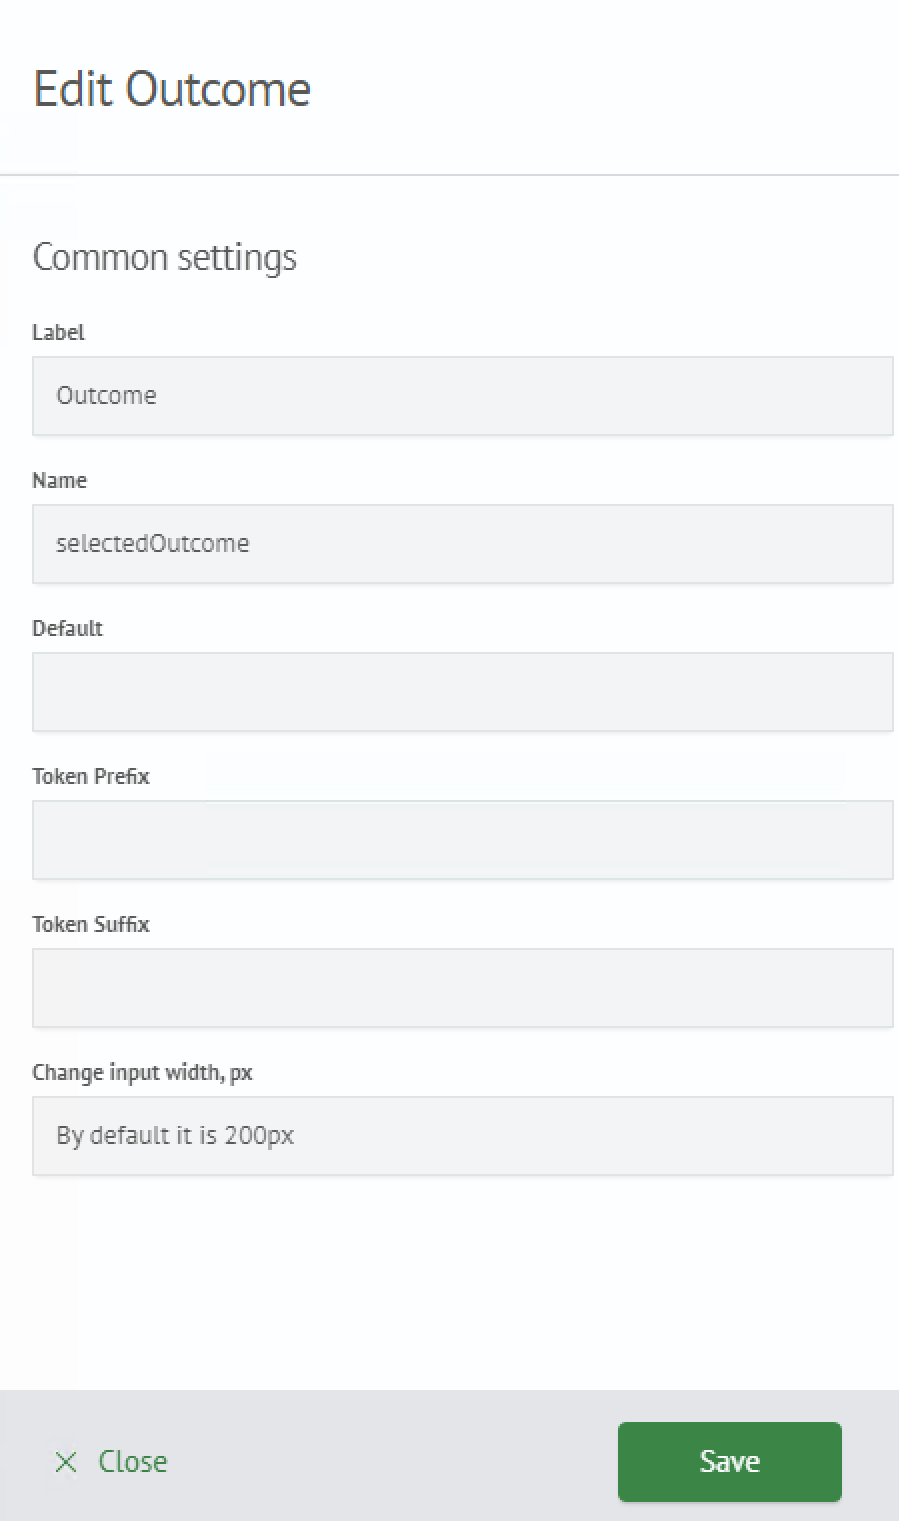
Result:

$click.name[X|Y]$ — chart series name
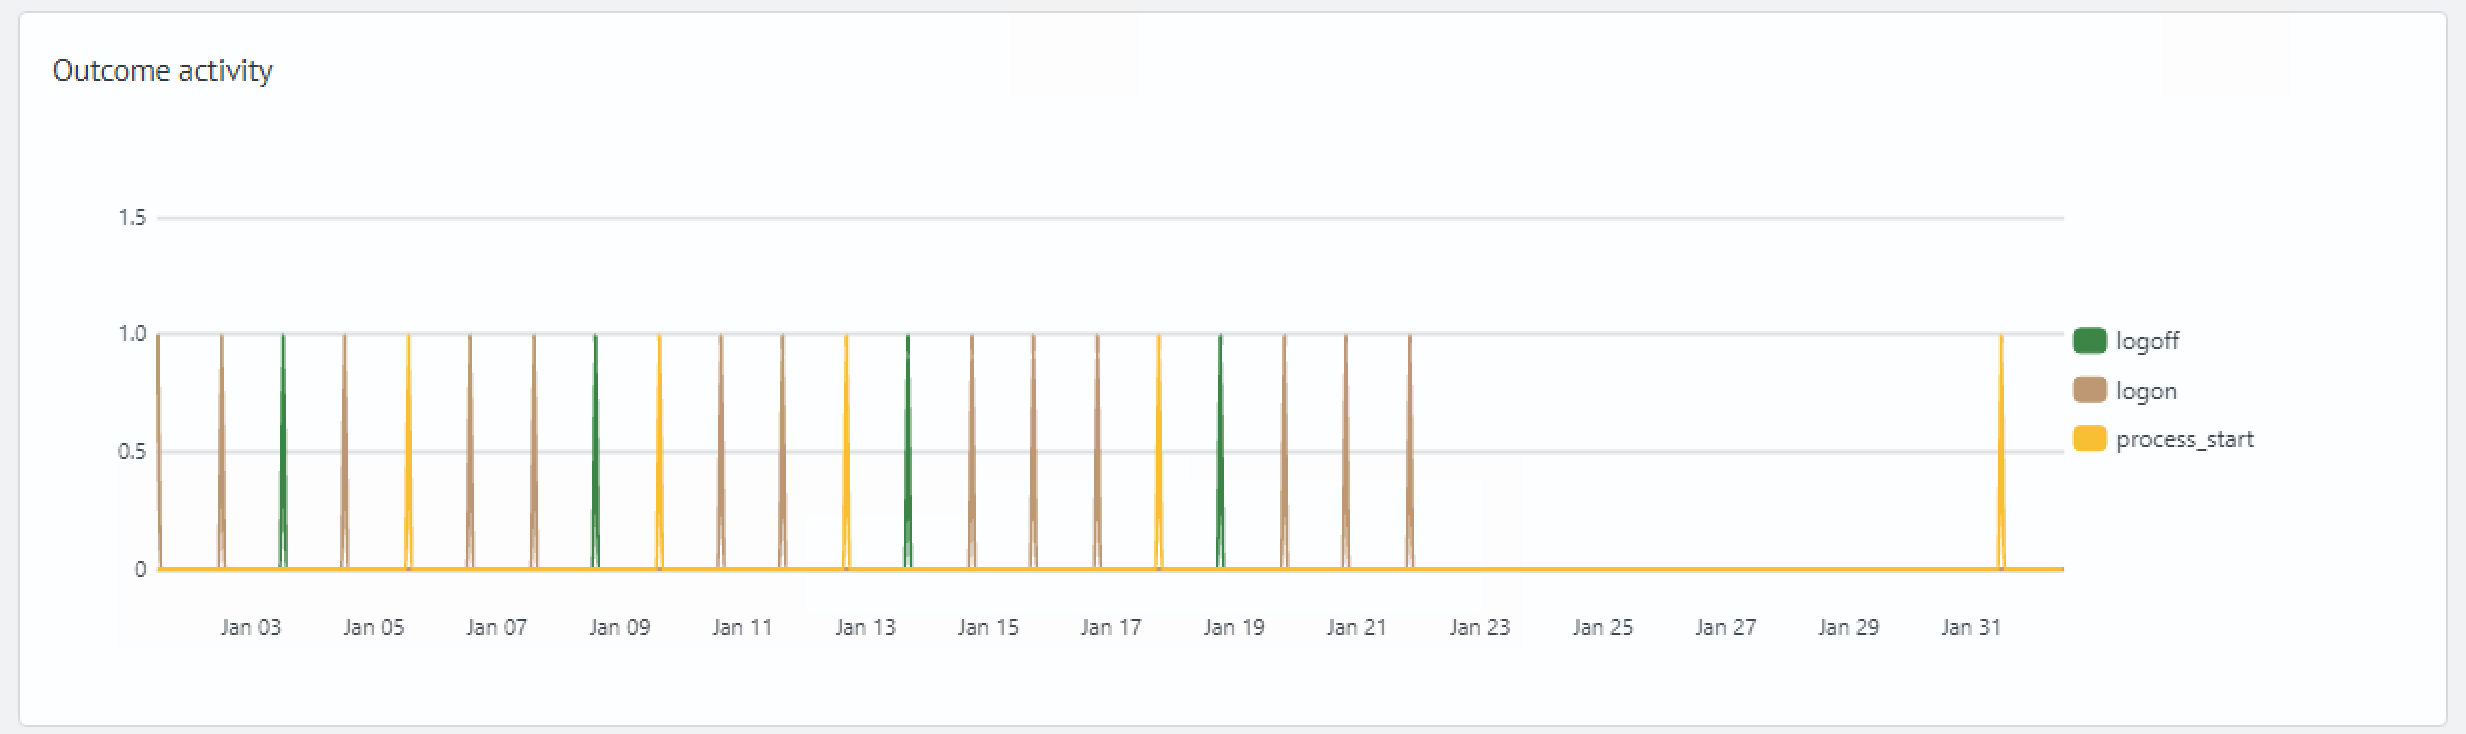
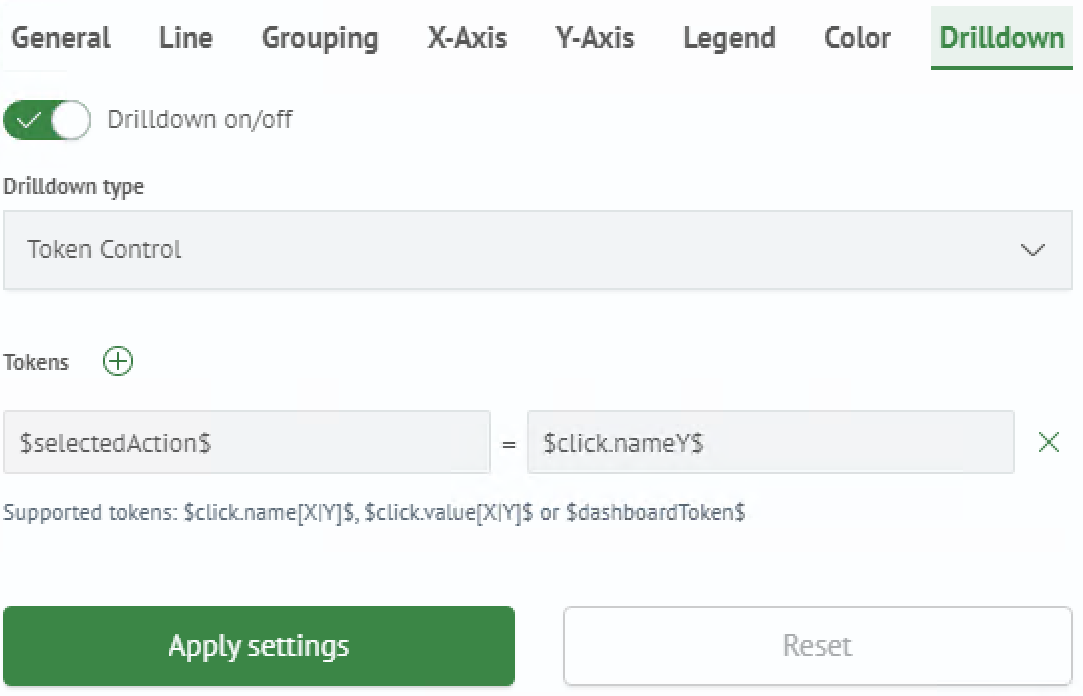
The $click.nameY$ token captures the series name when clicking on a line of a multi-series graph. Unlike $click.valueY$, it returns not the numerical value of the point, but the name of the data series.
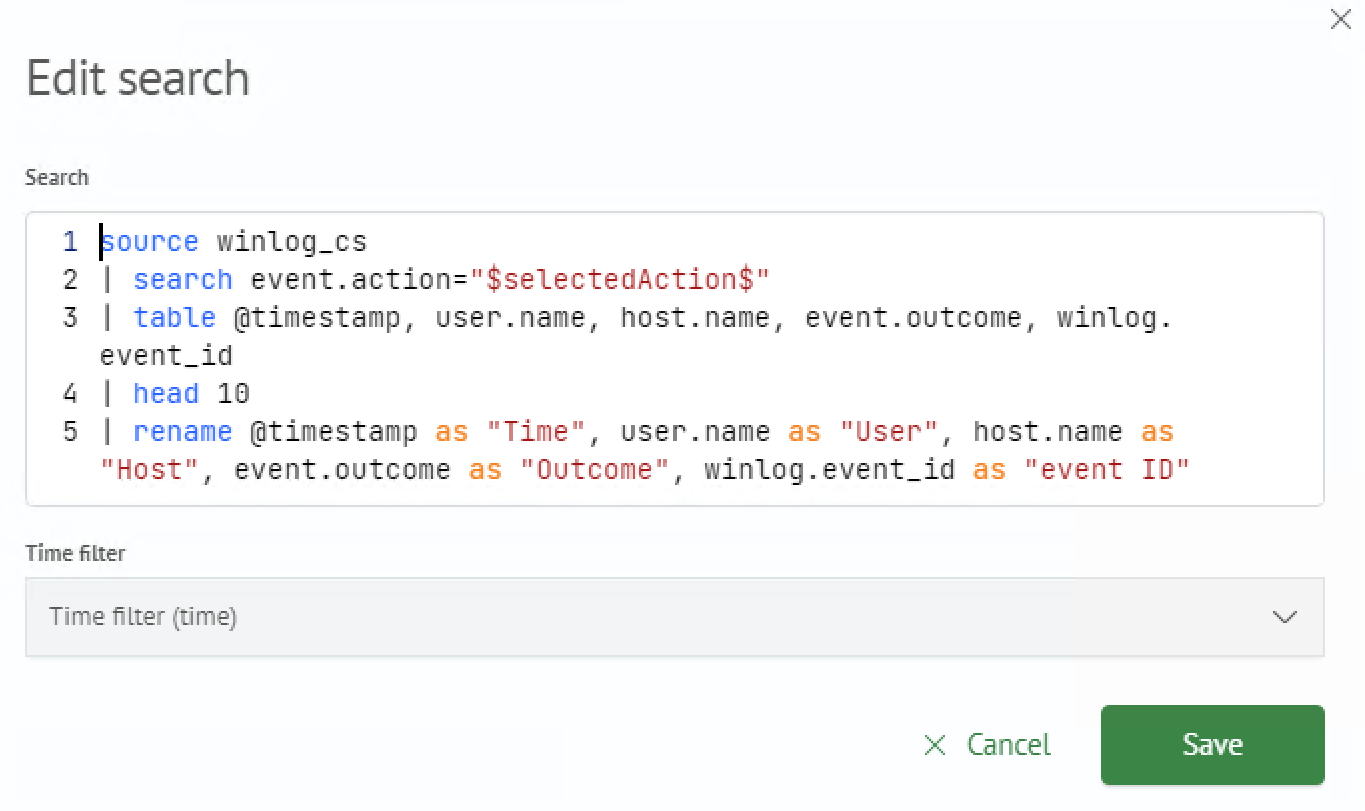
In the example, a line graph builds a separate series for each action type. When clicking on the logged-in line, the $click.nameY$ token gets the value logged-in.
Visualization:
Drilldown configuration:
Dependent table query:
Result:
$dashboardToken$ — dashboard filter value
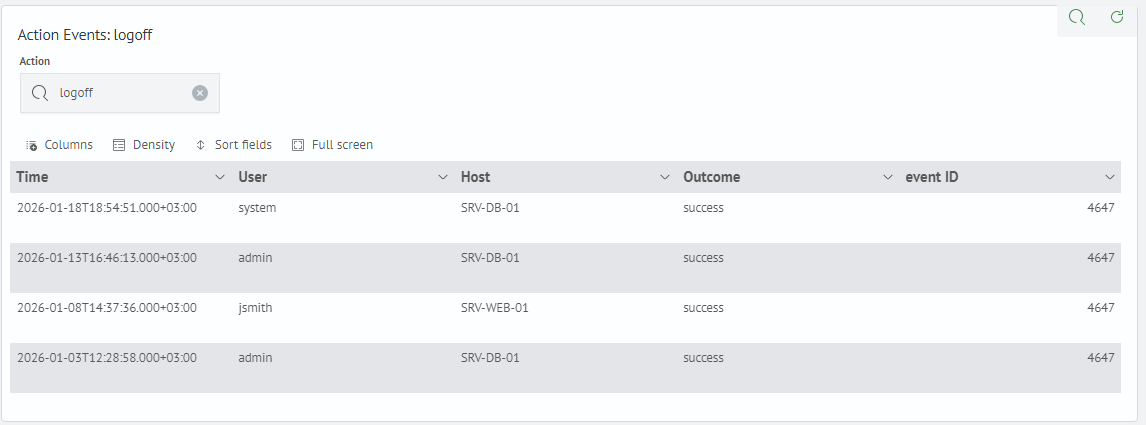
The $dashboardToken$ token corresponds to the value selected in the dashboard filter. Instead of dashboardToken, the system name of a specific filter is used.
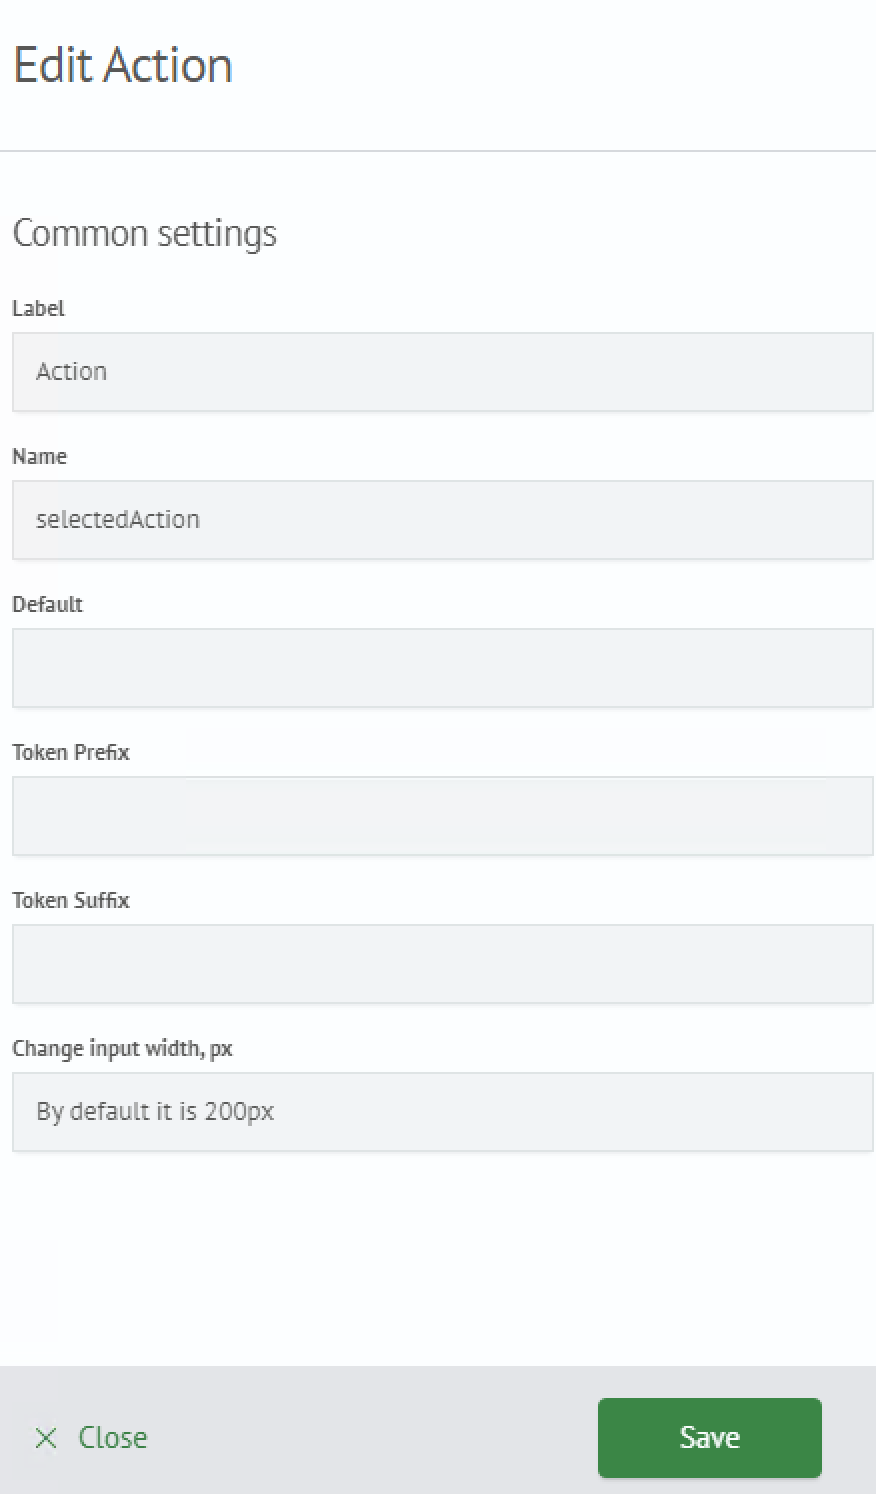
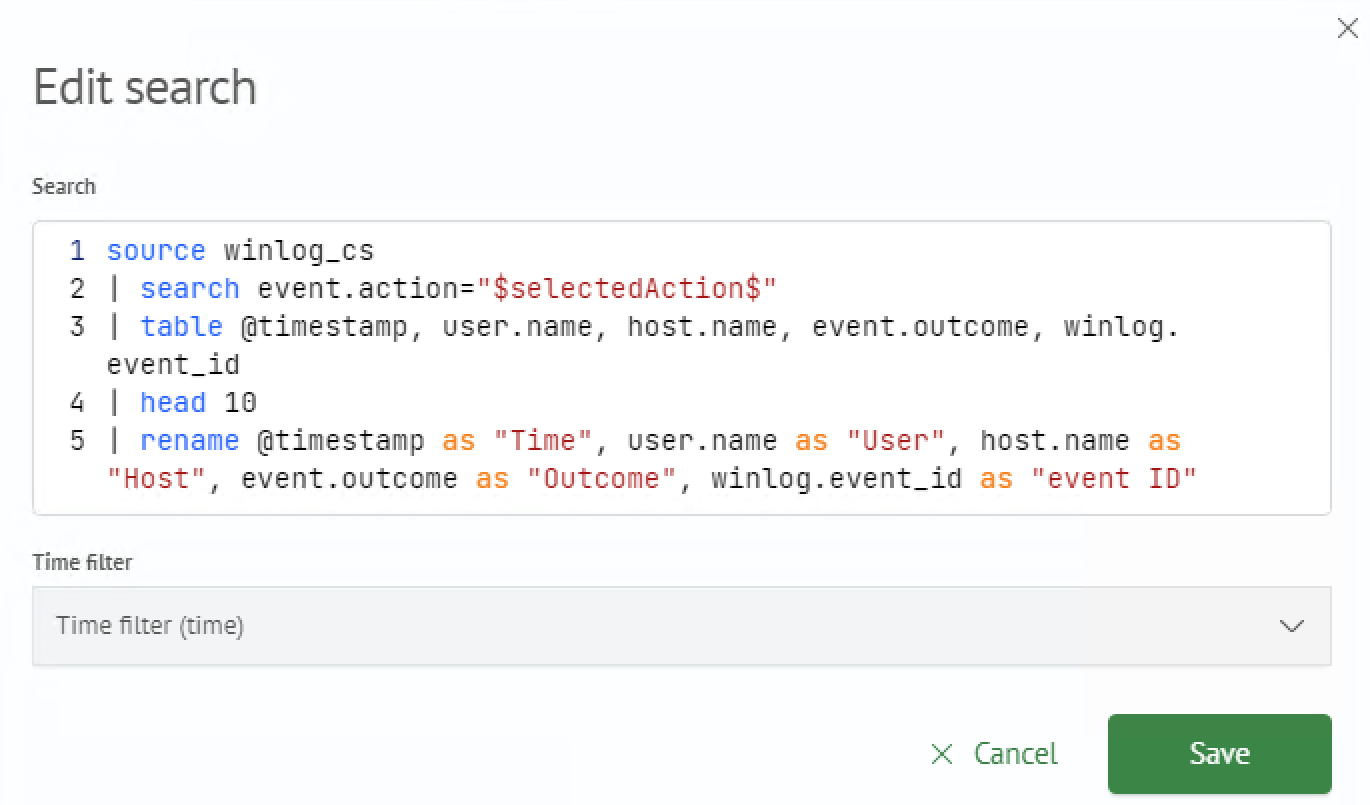
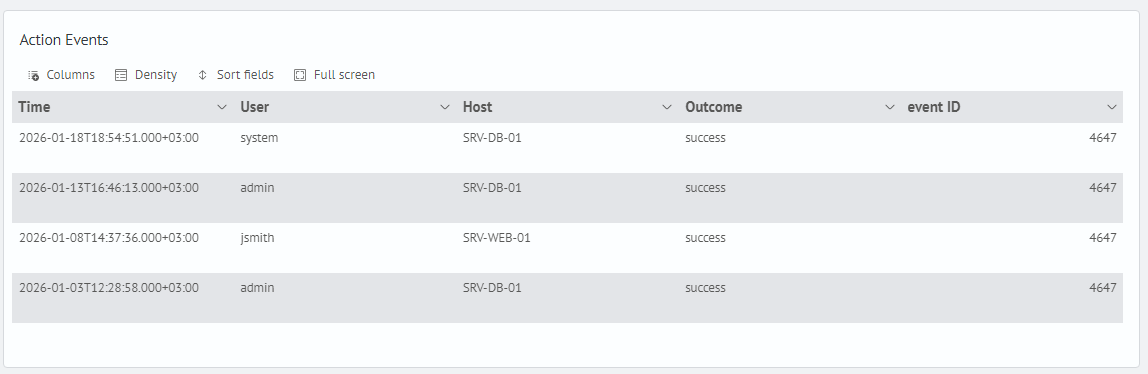
In the example, a Choice filter with system name action is placed on the dashboard. The visualization query uses the value of this filter through the $action$ token. When the filter value changes, the query is automatically re-executed.
Filter on dashboard:
Query using filter token:
Result:
$timeToken$ — time filter
The $timeToken$ token corresponds to the value of a Time filter. Instead of timeToken, the system name of a specific time filter is used. For example, if the filter's system name is time, the following sub-tokens are available:
$time.start$— start of time period$time.end$— end of time period$time.isPaused$— auto-refresh flag$time.refreshInterval$— refresh interval
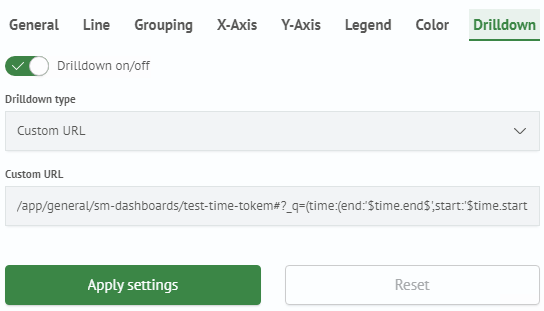
Values are used in Custom Link type drilldown to pass the time range to another dashboard:
/app/general/sm-dashboards/<target-dashboard>#?_q=(time:(end:'$time.end$',start:'$time.start$'))
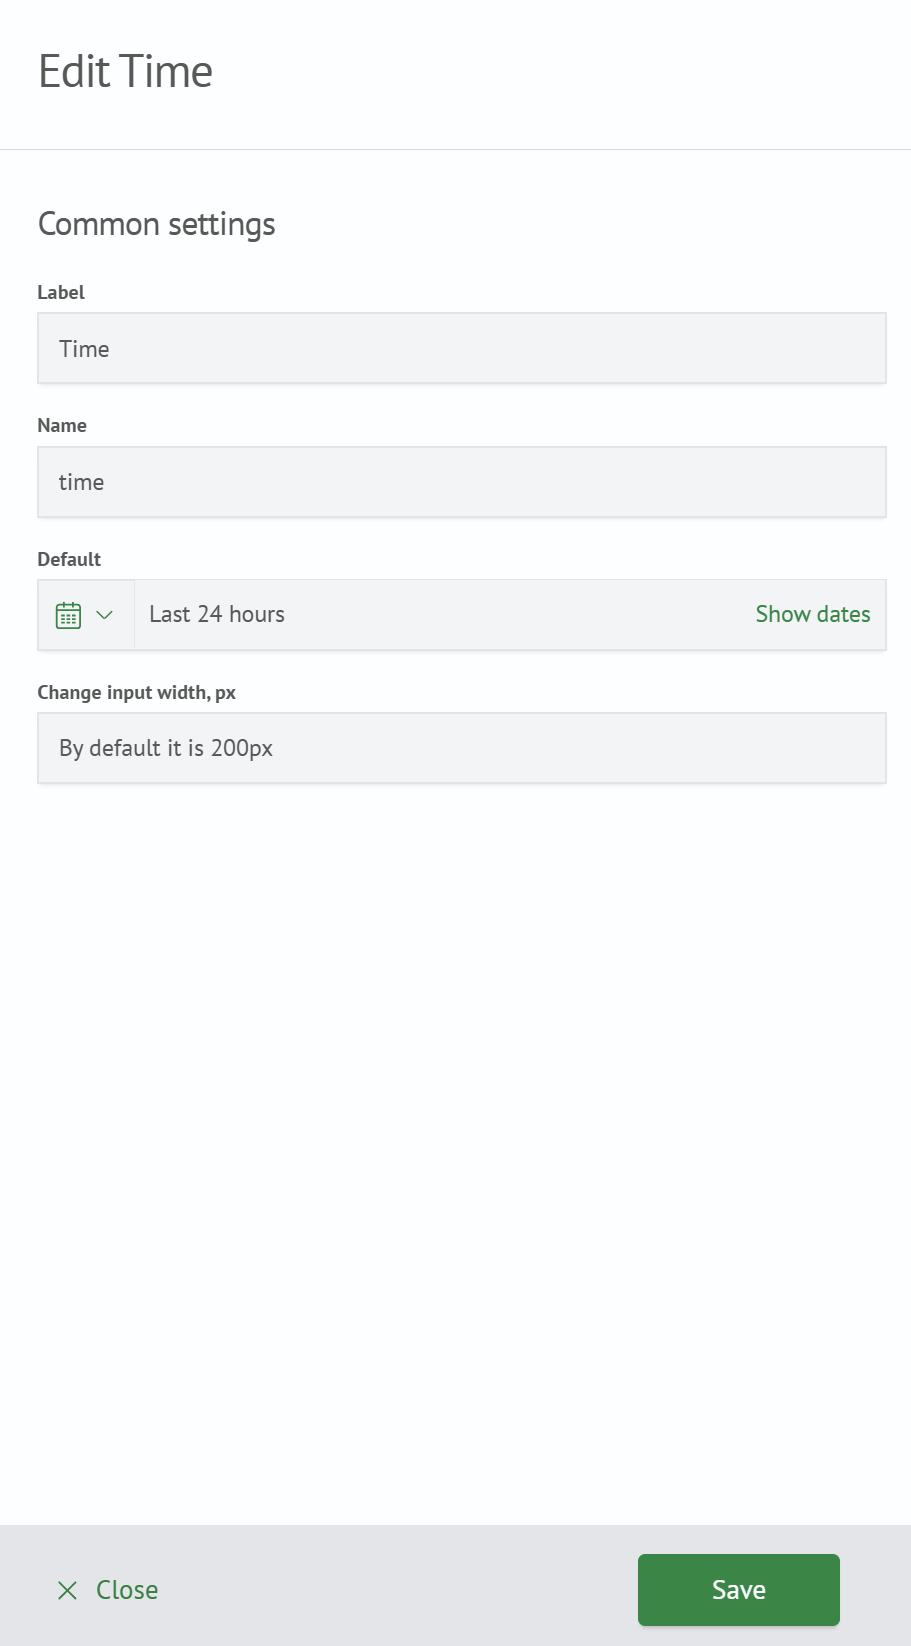
The target dashboard must have a filter with the same system name and a visualization that responds to it.
Time filter on source dashboard:
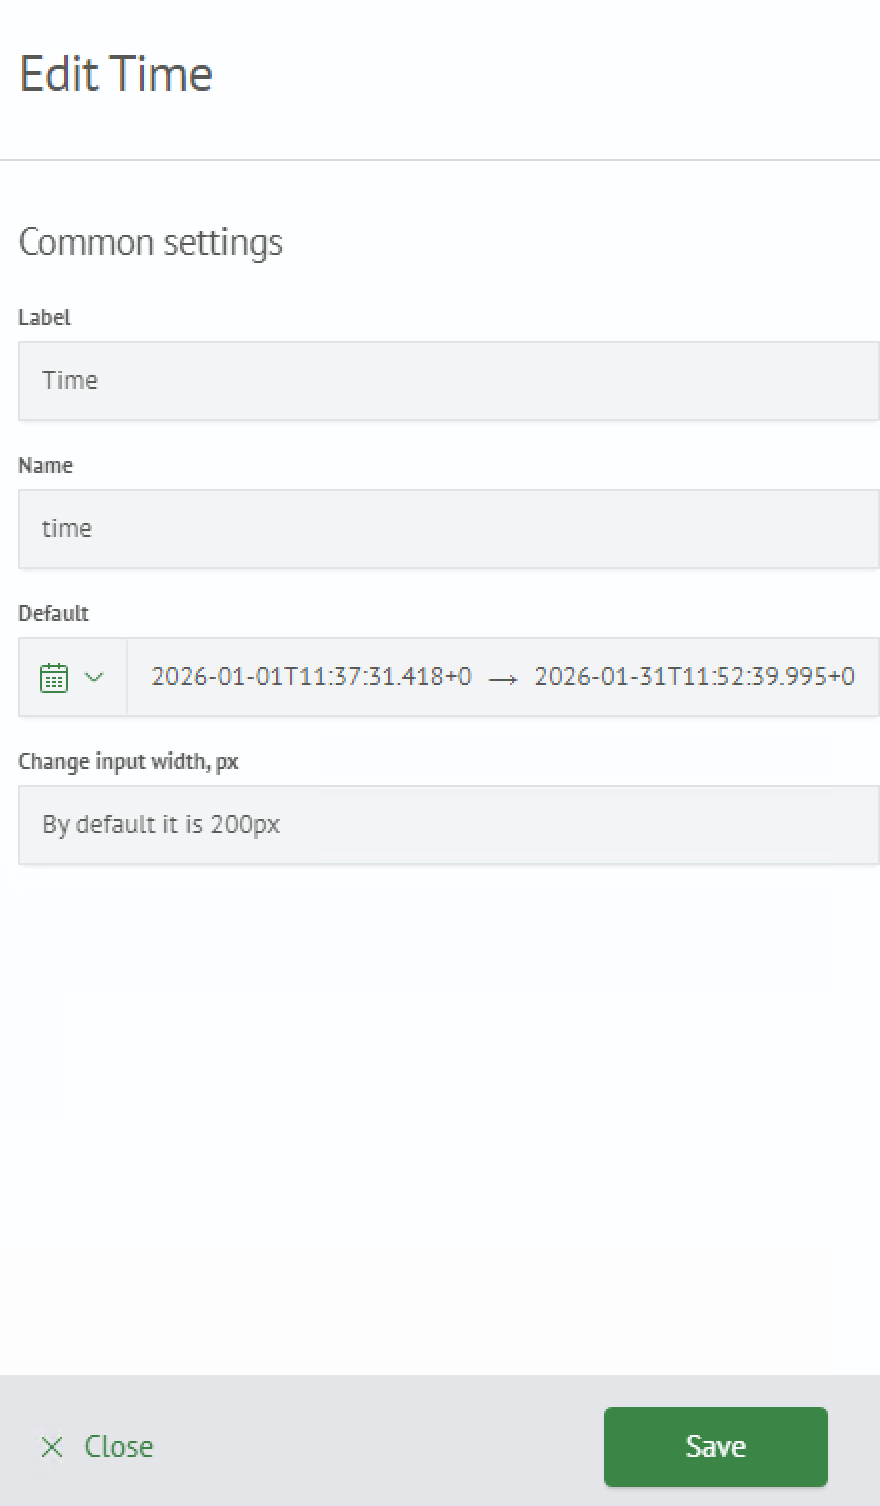
Drilldown configuration — type Custom Link:
Time filter on target dashboard (system name matches):
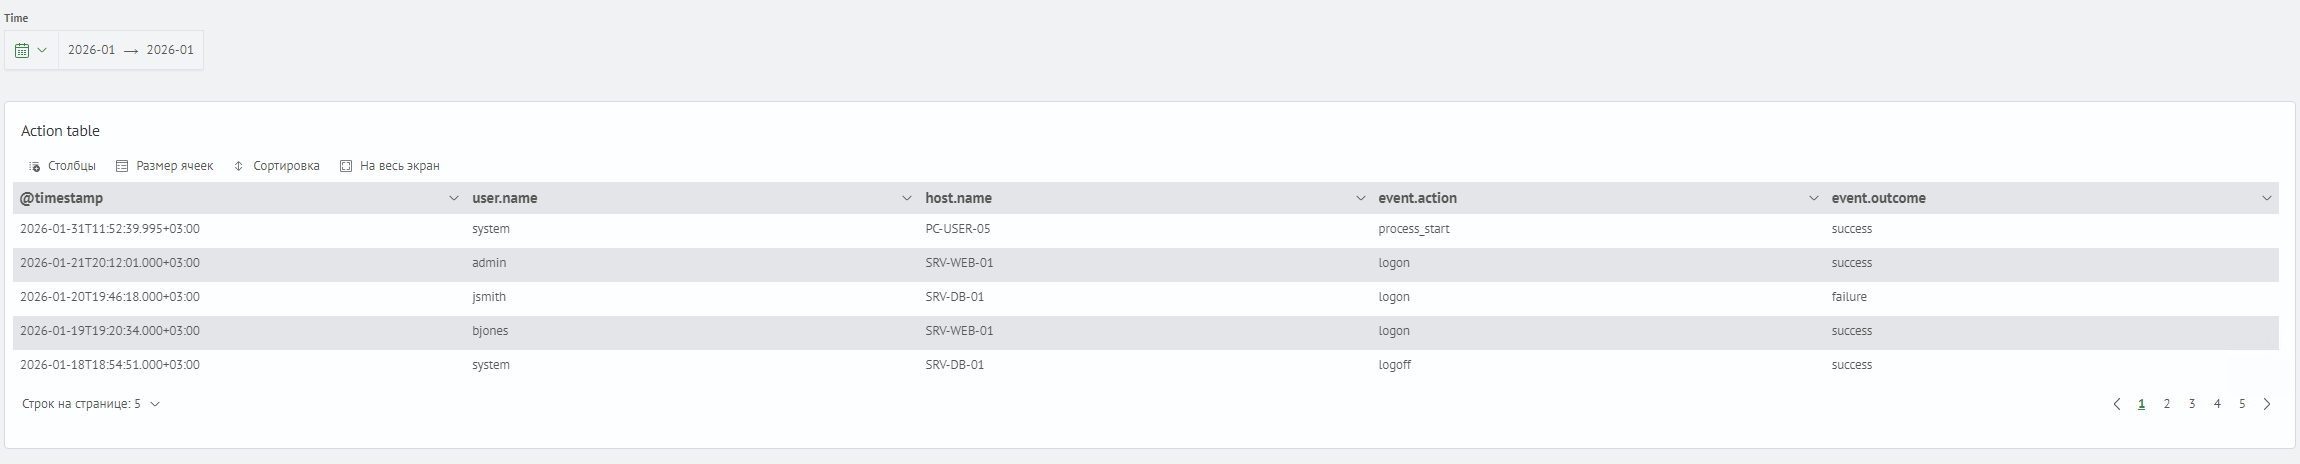
Visualization on target dashboard updates with the passed time range:
$data.fieldName$ — field from HTML visualization results
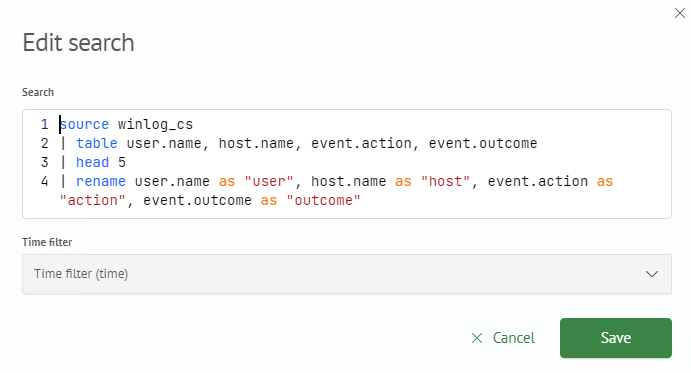
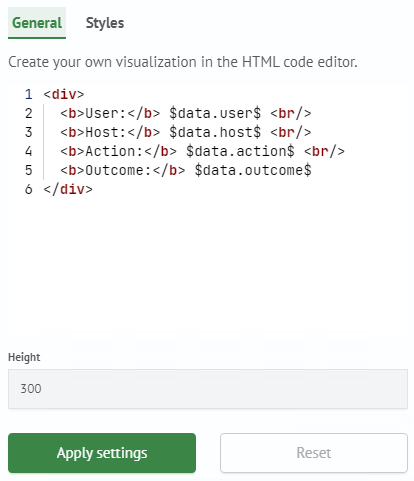
The $data.fieldName$ token is used only in HTML visualization. It substitutes the field value from the current query results row directly into the HTML template. fieldName is replaced with the column name from the results.
Query:
HTML template configuration — fields are substituted through tokens, for example $data.user$, $data.host$, $data.action$:
Result:
