Query Performance Monitoring Dashboard
Article Overview
Use this dashboard to analyze search operations on a selected Smart Monitor cluster node. It shows current Query and Fetch phase activity, scroll context state, changes in operation count and elapsed time, and related events from SME logs.
Dashboard Contents
Global and Local Filters
The dashboard provides the following controls:
Periodsets the time range for viewing dataNodeselects the node for search-load analysisTime Intervalsets the aggregation interval for time charts
Dashboard Metrics
Top Search Activity Indicators

| Panel | Shows | When to Review |
|---|---|---|
Query | The number of active operations in the search phase. This phase processes query conditions, filters, sorting, and aggregations. | At the start of search-latency diagnostics, especially when query execution time grows or queues appear in the search pool. |
Fetch | The number of active operations that retrieve found documents and form response data. | When latency may be related to a large response, expensive _source, highlighting, many fields, or disk reads. |
Scroll | The number of active operations that sequentially export data through scroll. | When bulk exports, integration jobs, or long reads of large document sets are running. |
Normal operation indicators: the number of current operations changes with the load and returns to its usual range.
Further investigation is needed when growth is sustained; compare it with operation duration, the search pool queue, CPU, and input/output.
Top indicator values are useful for a quick assessment of current activity, but compare them with time charts, logs, and node resource metrics before drawing conclusions.
Query Phase Metrics
| Panel | Shows | When to Review | Normal Operation Indicators | When Further Investigation Is Needed |
|---|---|---|---|---|
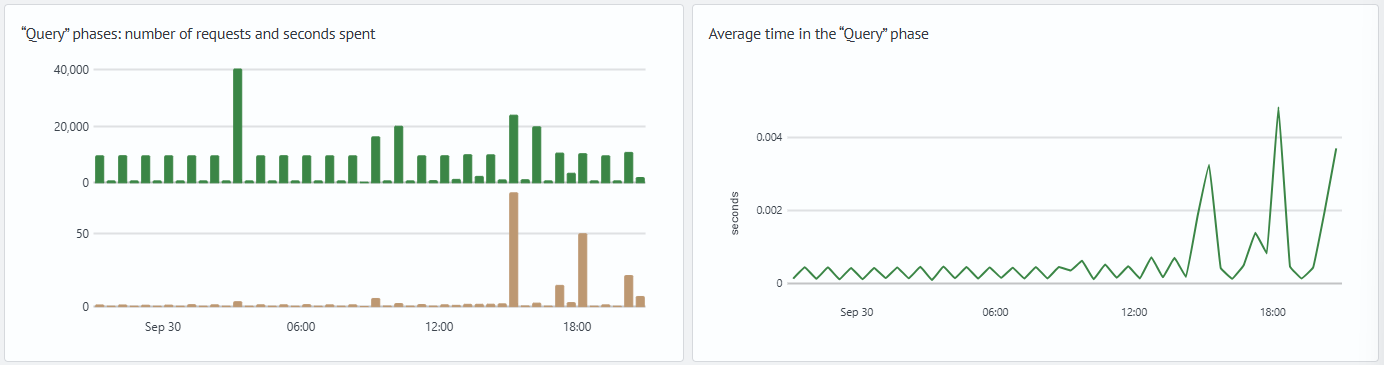
Query Phase: Request Count and Time Spent, Seconds | The number of Query operations for the interval and the total time spent executing them. | When you need to determine whether search load itself grew or each operation began taking longer. | Total time changes proportionally to the number of shard operations. | If total time grows faster than the number of operations, check the average duration, query composition, and node resources. |
Average Query Phase Time | The calculated average duration of one Query operation for the interval. | When a large data volume, expensive filters, aggregations, scripts, a wide time range, or search across many shards is suspected. | The value matches the usual level for a comparable query type and does not disrupt operation. | Sustained growth with a stable operation count can indicate higher resource consumption by one shard operation. Confirm the cause from queries, shard count, queues, and resources. |
If average Query time grows, review operation composition in the Cluster Query Count by Type dashboard. There you can review search actions, long-running tasks, and relationships between child operations and the parent task ID. If growth coincides with queues or rejected operations in a thread pool, open the Node Resource Monitoring dashboard.
Fetch Phase Metrics
| Panel | Shows | When to Review | Normal Operation Indicators / When Further Investigation Is Needed |
|---|---|---|---|
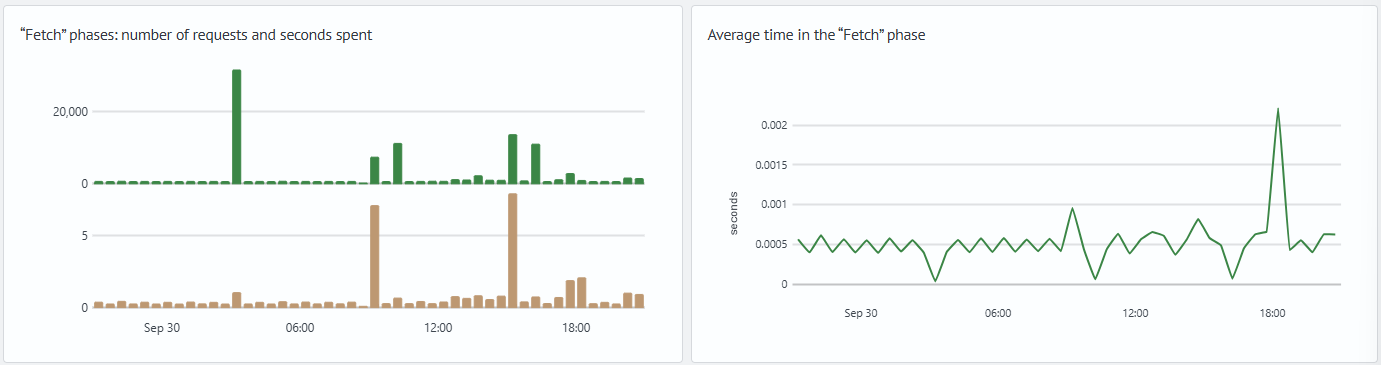
Fetch Phase: Request Count and Time Spent, Seconds | The number of Fetch operations for the interval and the total time spent retrieving response data. | When the search phase completes but the query takes a long time to retrieve documents or returns a large volume of data. | Same as for the Query phase panels. |
Average Fetch Phase Time | The calculated average duration of one Fetch operation for the interval. | When size is large, _source is expensive, highlighting is enabled, many fields are returned, or slow reads are observed. | Same as for the Query phase panels. |
If Fetch grows, compare the period with the Node Resource Monitoring dashboard: CPU, memory, storage utilization, read/write volume, and search pool metrics are important. If heap or direct buffer usage or GC pauses also grow, continue the investigation in the JVM Node Monitoring dashboard.
Scroll Operation Metrics
| Panel | Shows | When to Review | Normal Operation Indicators | When Further Investigation Is Needed |
|---|---|---|---|---|
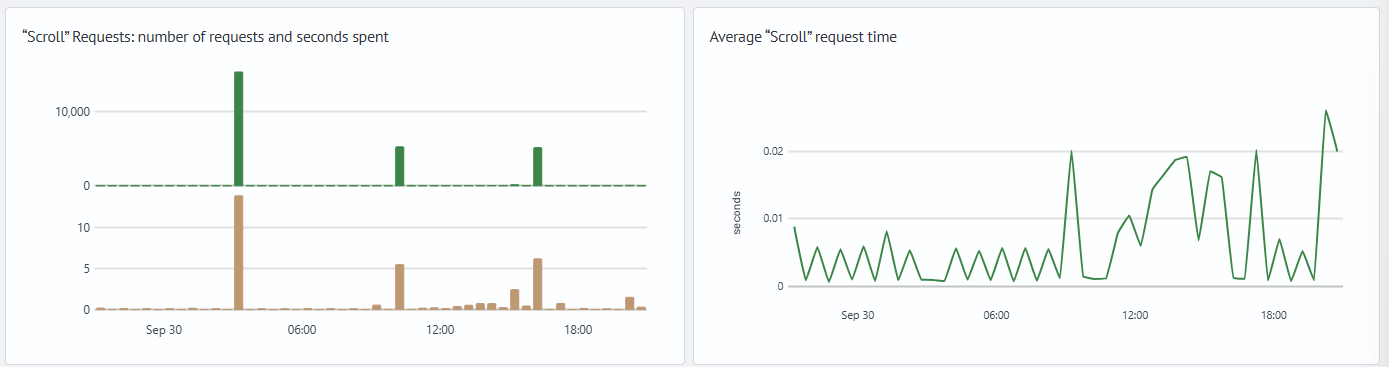
Scroll Requests: Request Count and Time Spent, Seconds | The number of Scroll operations for the interval and the total time spent sequentially exporting data. | When you need to assess the load from bulk exports, reports, or integration reads. | Changes match known exports and do not affect system state. | Compare sustained growth in time or operation count with export volume, open contexts, input/output, and memory. |
Average Scroll Request Time | The calculated average duration of one Scroll operation for the interval. | When exporting large data sets starts taking substantially longer or affects adjacent search operations. | The value is comparable for exports with the same volume and structure. | Assess growth against the requirements of the specific export and its effect on other queries; it does not prove a problem without data-volume context. |
Review growing Scroll activity together with node resources. In the Node Resource Monitoring dashboard, review CPU, memory, input/output, HTTP connections, file descriptors, and thread pool queues. If heap or direct buffer usage grows during the same period, review the JVM Node Monitoring dashboard.
Log Panels
| Panel | Shows | When to Review |
|---|---|---|
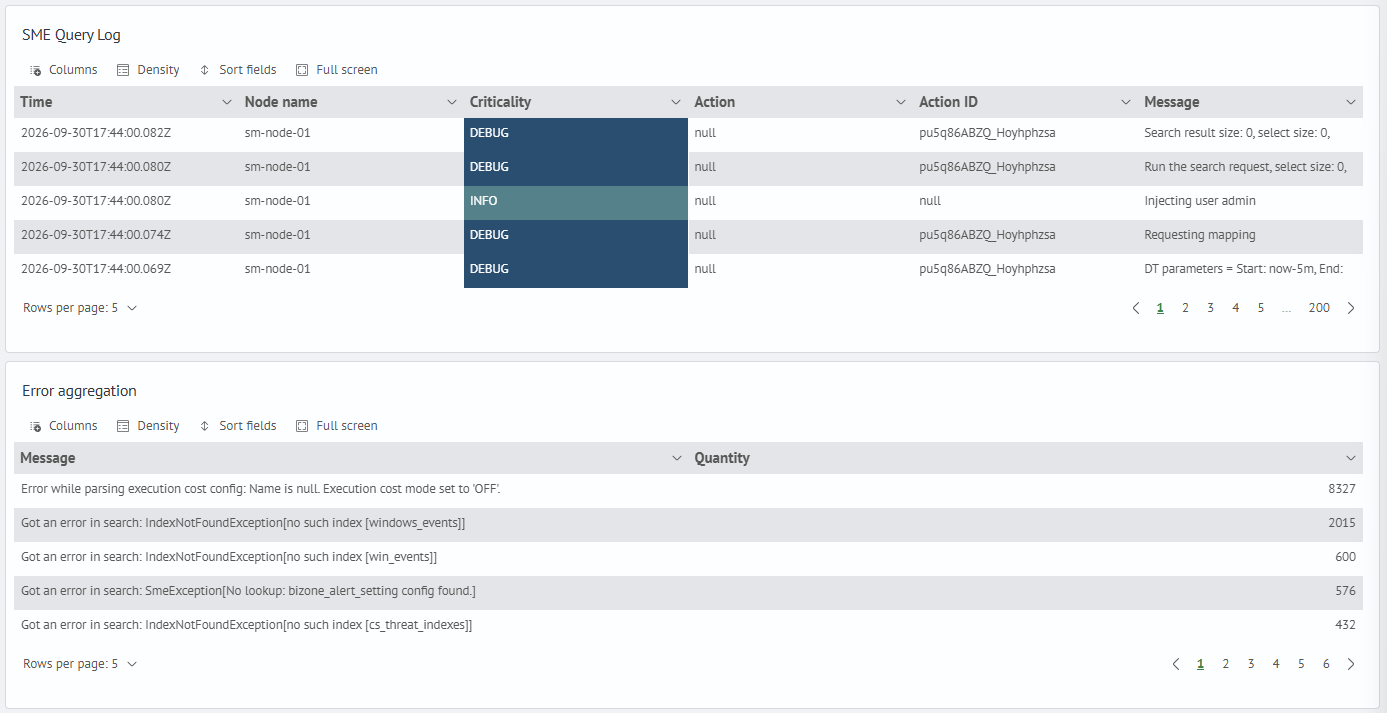
SME Query Log | Events related to search operation execution: time, node, severity, action, action ID, and message. | When you need to move from a chart to a specific query, client, error, or execution period. |
Error Aggregation | Repeated warnings and errors grouped by a common message characteristic. | When you need to assess the scale of a similar problem and choose events for detailed analysis. |
Use logs after the charts identify the interval and affected nodes. If search errors coincide with a changed cluster state, reduced shard availability, or node loss, continue the investigation in the Cluster Health dashboard.
How to Read Time Metrics
Query, Fetch, and Scroll metrics relate to shard-level operations. Therefore, they cannot be directly equated to the number of unique client queries or the full response latency seen by a client.
Analyze operation count and total time charts together:
- if only operation count grows, load may have increased without degrading an individual query
- if operation count is stable but total and average time grow, each operation has begun using more resources
- if operation count, total time, and average time grow together, the node processes more operations and each one requires more time
Average time on charts is a calculated value for the selected interval. It helps find a problematic period, but does not replace analysis of a specific query, the number of affected shards, response parameters, node resources, and log events.
Total shard operation time can accumulate in parallel across several shards and nodes. Do not interpret it directly as the response time of one client query.
Typical Scenarios
Growing Calculated Search Operation Time
Simultaneous growth in shard operation count, total time, and calculated average time identifies a period that requires further investigation. The dashboard does not identify the specific client query or cause of the change: this situation can be related to changes in query volume or complexity, the number of affected shards, response parameters, data distribution, or resource load.
The charts display the following signs:
- the
Query Phase: Request Count and Time Spent, Secondspanel shows simultaneous growth in the number of shardQueryoperations and their total time - the
Average Query Phase Timepanel shows an increase in calculated operation time. The dashboard does not define a universal acceptable threshold - the
Fetch Phase: Request Count and Time Spent, SecondsandAverage Fetch Phase Timepanels show a similar change forFetchoperations - the
Scroll Requests: Request Count and Time Spent, SecondsandAverage Scroll Request Timepanels show changes inScrolloperations. These panels do not show the number of open contexts



In the images, the increments of shard operation count and total time increase after 12:30. Calculated average Query time remains near 40 seconds, Fetch near 32 seconds, and Scroll near 80 seconds. This pattern shows sustained growth in shard search operation time, but does not prove that all three panels refer to one client query or one scroll session.
For diagnosis:
- Record the growth interval and selected node
- In the
SME Query Logpanel, manually filter records for this node by theNode Namecolumn because the globalNodefilter does not affect the log - Compare the period with the Cluster Query Count by Type dashboard
- Review CPU, memory, read activity, and
searchpool metrics in the Node Resource Monitoring dashboard - For a specific query, review the number of affected shards,
size,_source, aggregations, and the execution profile
In a multi-tier architecture, start with the nodes that host shards of the requested indices. Depending on the time range and data distribution, these can be hot, warm, or cold tiers. Compare nodes with the same role and configuration.
Non-zero shard search metrics on a master node do not by themselves prove a configuration error. First check combined roles, shard placement, and routing.