Logstash Monitoring Dashboard
Article Overview
Use this dashboard to monitor Logstash nodes that collect, process, and send events to Smart Monitor. It helps determine whether Logstash is available, whether CPU and JVM memory are sufficient, and whether processing or output delays are present.
Dashboard Contents
Global and Local Filters
Time Rangesets the data viewing periodHost Nameselects a Logstash node for detailed analysisTypefilters the message log by record typeTagfilters the message log by message tag
Color Indication
Use color indication as an initial assessment guide, not as independent evidence of a problem.
Dashboard Metrics
Identification and Operational State
| Panel | What It Shows | When to Review |
|---|---|---|
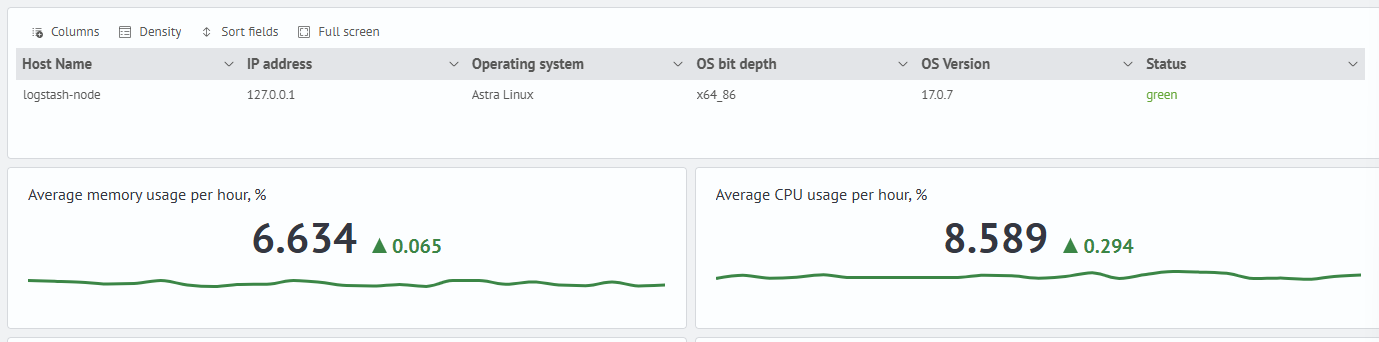
| Node Identification Table | Host name and IP address, operating-system parameters, and Logstash status. | At the start of diagnosis to verify the selected node and basic Logstash state. |
| "Average Memory Usage per Hour, %" | Summary JVM heap-usage metric. | When memory shortage, frequent GC pauses, or unstable event processing is suspected. |
| "Average CPU Usage per Hour, %" | Summary CPU-usage metric for the Logstash process. | When investigating compute limits, overloaded filters, or output plugins. |
CPU and JVM Resources

| Panel | What It Shows | When to Review |
|---|---|---|
| "Average Memory Load, %" | JVM heap-use trend for the selected node. | To determine whether memory pressure is increasing and coincides with processing delays. |
| "Average CPU Load, %" | CPU-use trend for the Logstash process. | During sustained high load, CPU spikes, or throughput degradation. |
Event Flow
| Panel | What It Shows | When to Review |
|---|---|---|
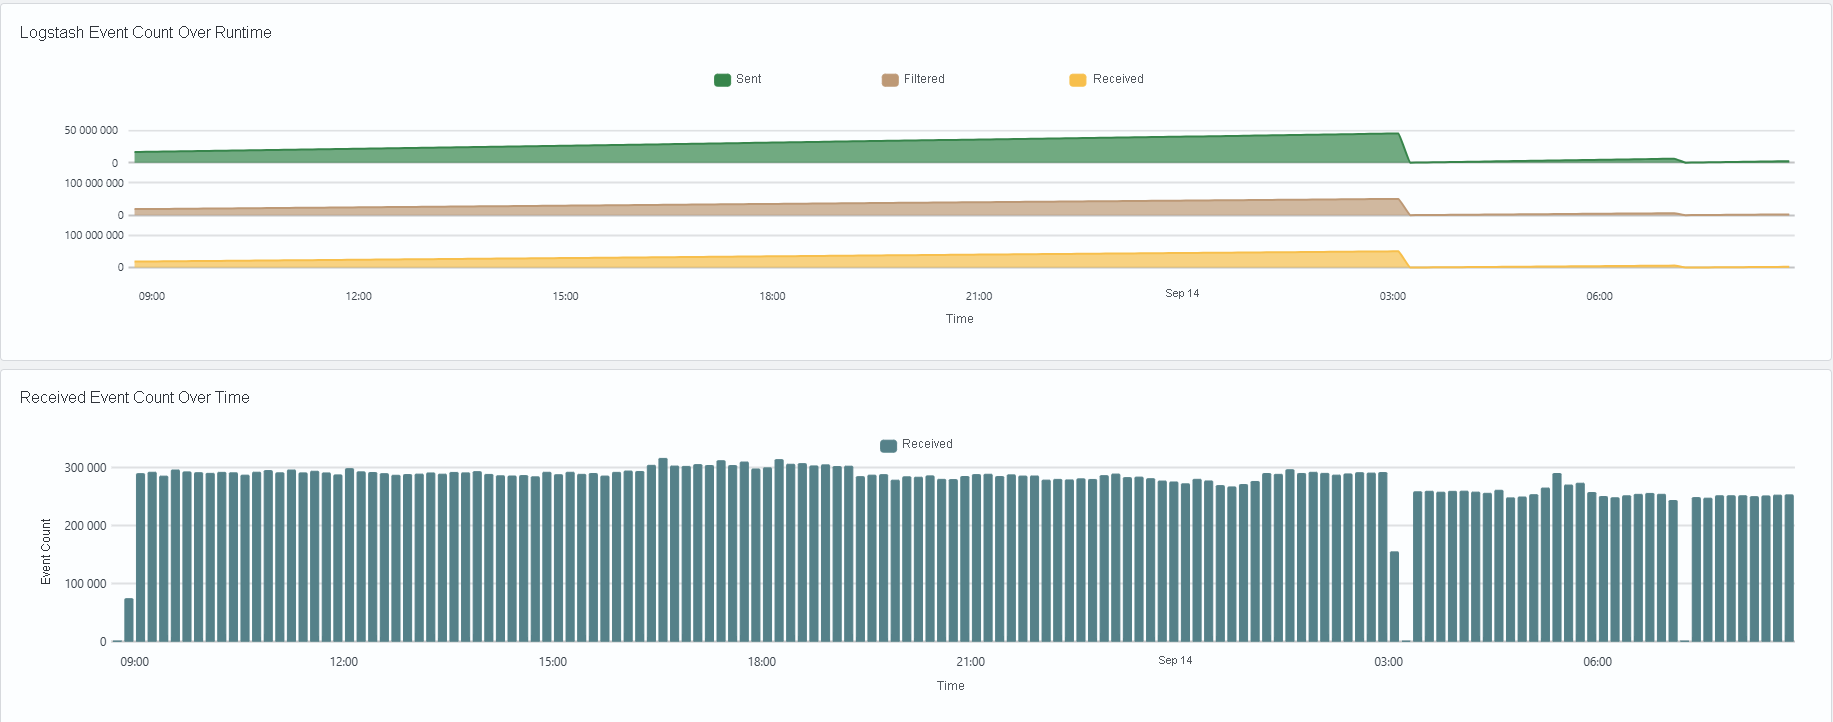
| "Logstash Event Count Over Runtime" | Ratio of incoming, processed, and sent events. | When processing delay, send lag, or throughput changes are suspected. |
| "Received Event Count Over Time" | Incoming-event trend. | To locate periods of higher input volume and correlate them with CPU, JVM, and output plugins. |
Collector Metrics

Review outgoing event throughput and throttling by pipeline. Use pipeline.workers, pipeline.batch.size, queue.type, and queue.max_bytes as applicable. Check current values in the Pipelines Information panel or with GET /_node/pipelines?pretty; update pipelines.yml for an individual pipeline and logstash.yml for shared settings.
Pipelines and Hot Threads
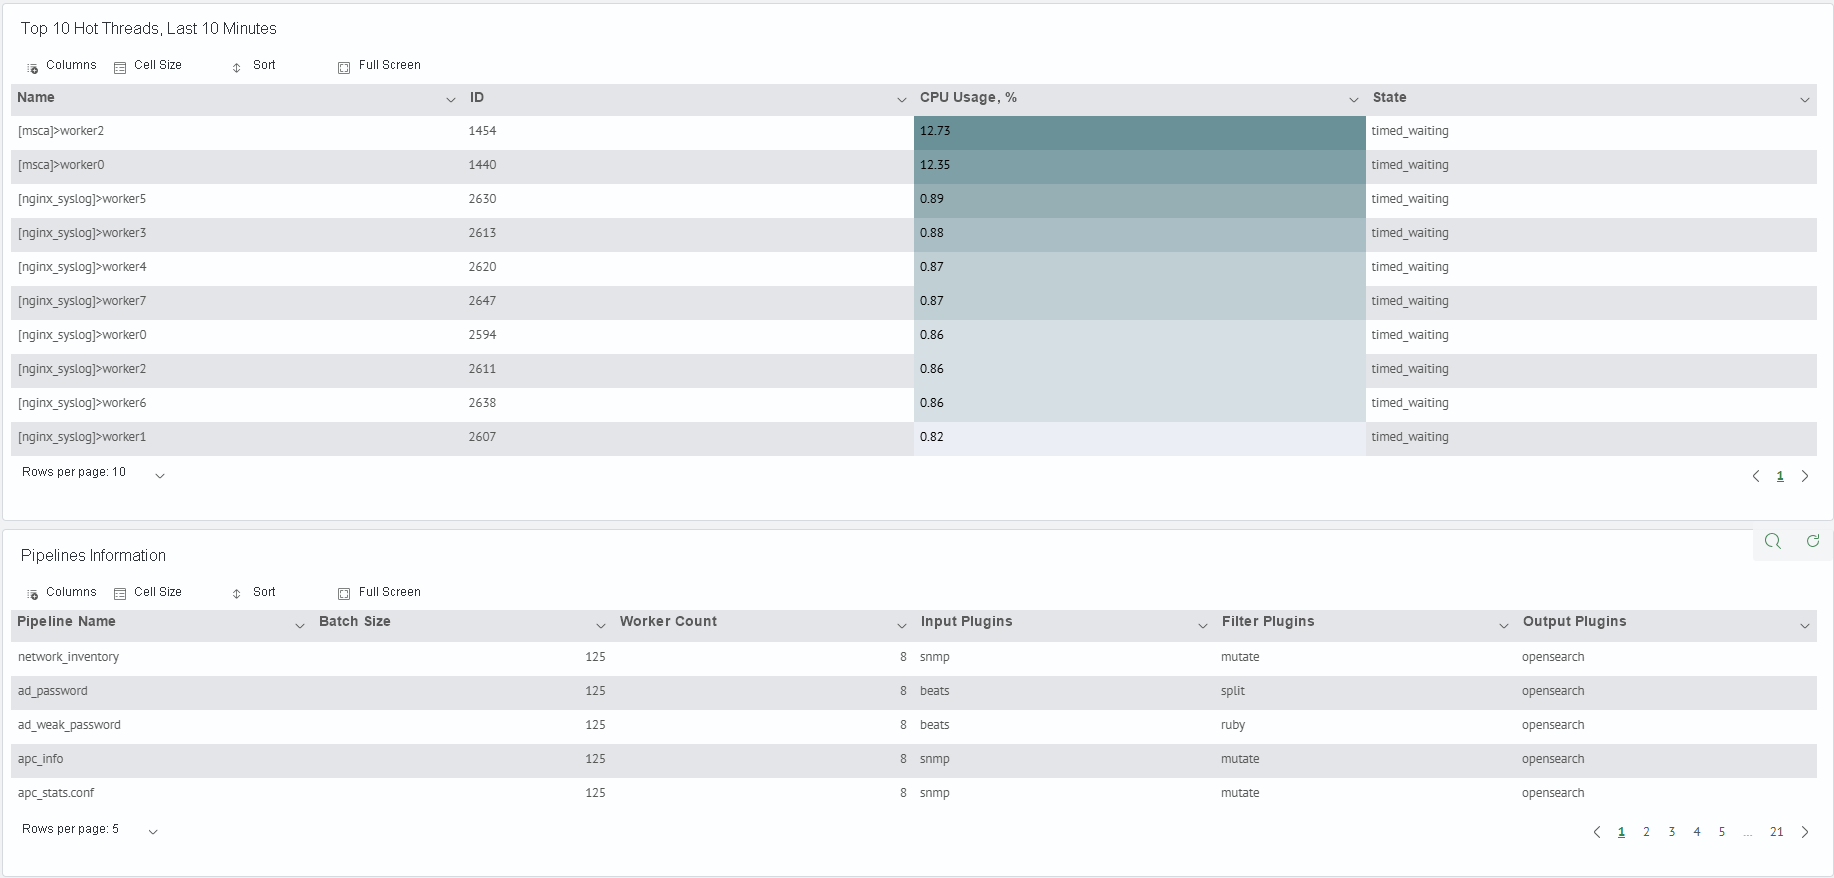
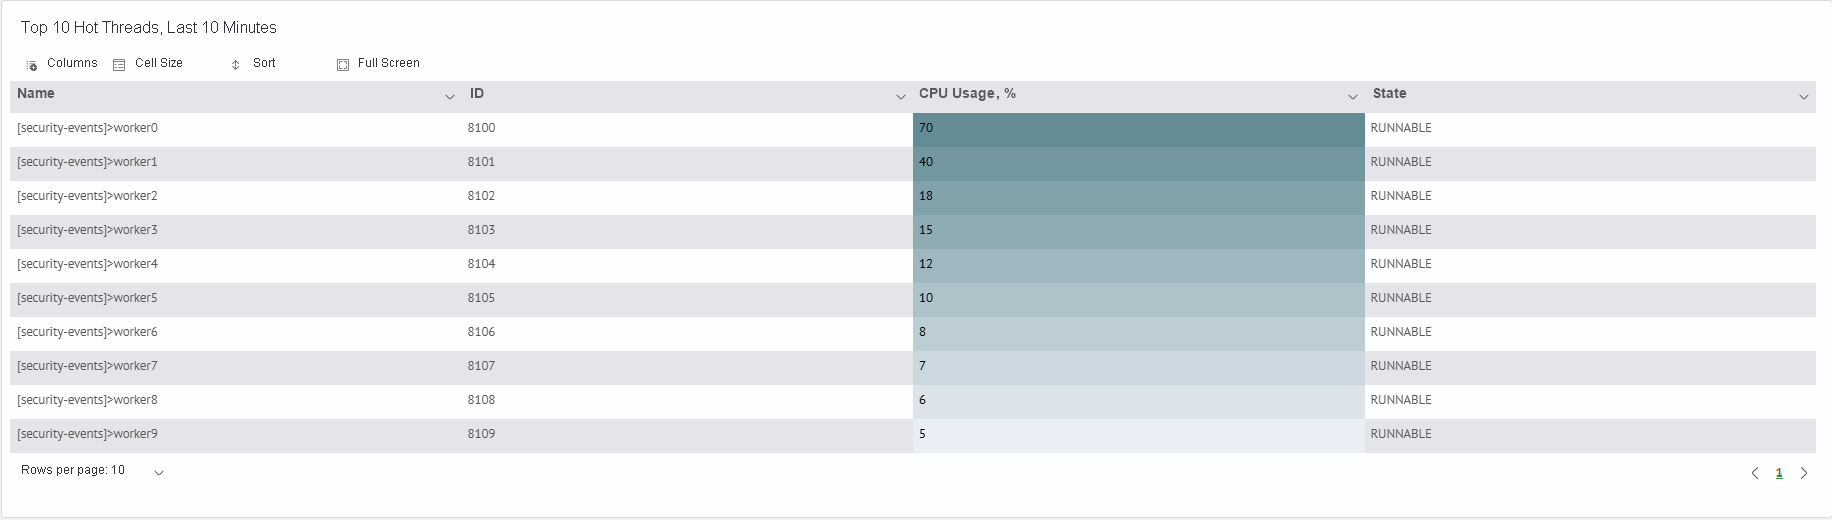
Use Top 10 Hot Threads, Last 10 Minutes to identify pipelines that require further review during high CPU load. Use Pipelines Information to review batch size, worker count, and input, filter, and output plugins.
Logs and Errors
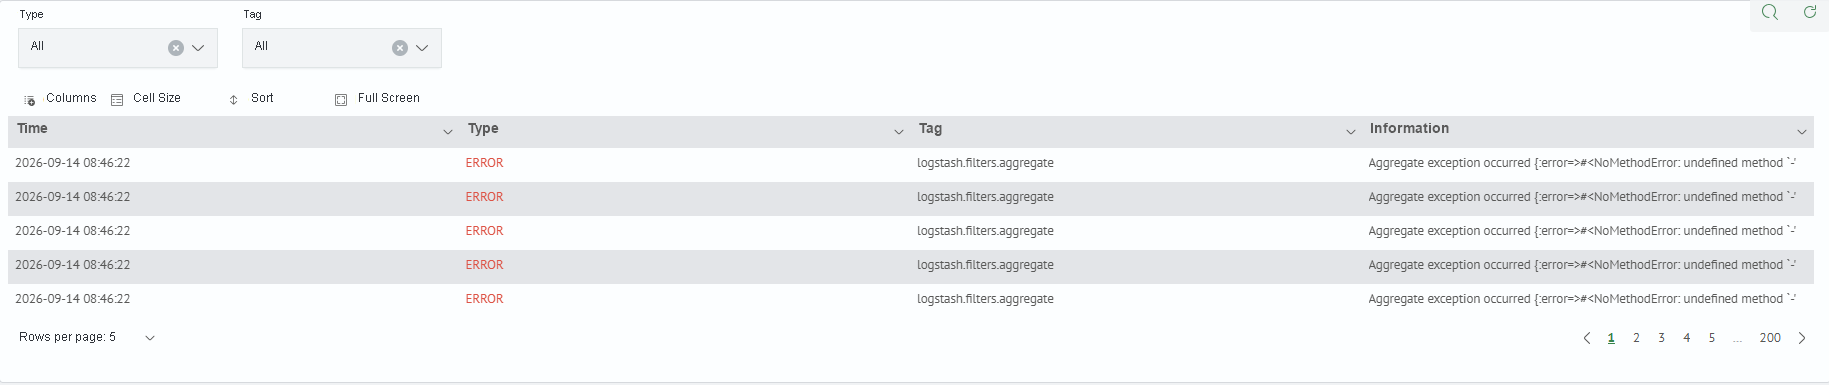
Use the message log to restore event chronology and investigate plugin errors. Use error aggregation to prioritize repeated warnings and errors.
Problem Diagnosis Examples
Where to Find Details
Use the current dashboard for Logstash availability, event flow, message logs, and error aggregation. For JVM pressure, open Logstash Node JVM Monitoring. For output-plugin issues or data-storage degradation, use Indexing Performance Monitoring and Cluster Health.
Initial Logstash State Assessment
Correlate CPU and JVM heap metrics, event charts, and log messages in the same time range. These signals help distinguish resource load from event-processing and delivery issues.
CPU and JVM Resource Analysis
Analyze CPU and JVM heap trends rather than individual values. During sustained CPU load, verify whether the same worker threads recur in Hot Threads. A simultaneous heap increase or GC pauses can indicate JVM degradation in addition to compute load.
Event Flow Analysis
Choose the interval in which flow divergence began and correlate it with CPU, JVM heap, and output-plugin messages. This helps determine whether the lag occurs while processing or sending events.
Checking Pipelines and Hot Threads
Use Hot Threads to select the first pipeline to inspect. For detailed runtime data, use the Logstash Node Stats API:
curl -s 'http://localhost:9600/_node/stats/pipelines?pretty'
For one pipeline, specify its identifier in the path:
curl -s 'http://localhost:9600/_node/stats/pipelines/<pipeline_id>?pretty'
Correlate events.in, events.filtered, events.out, flow throughput metrics, flow.worker_utilization, flow.worker_concurrency, flow.queue_backpressure, and filter and output plugin statistics. API statistics do not replace configuration verification.
Checking Events and Errors
Use logs to confirm a cause after metrics identify a symptom and approximate interval. Correlate repeated errors with event charts and node resources.
Typical Scenarios
Indirect Signs of Throughput Degradation
Back pressure can occur when Logstash cannot send events as quickly as it receives them. The dashboard shows indirect signs only; confirm flow divergence through logs, output-plugin state, and the receiving system.

High CPU Use in the Hot Threads Table
During sustained high CPU use, compare several Hot Threads snapshots. Repeated worker threads from one pipeline identify it for review but do not identify a specific plugin or configuration line.