Cluster Query Count by Type Dashboard
Article Overview
Use this dashboard to analyze Smart Monitor tasks running in the cluster. In this article, queries are task records, including user operations, internal service actions, search, write, monitoring, and cluster maintenance operations.
The panels help identify when activity changed, the predominant operation type, affected nodes, and relationships between child tasks. The dashboard alone cannot determine the exact cause of a delay, resource consumption, or the original user query without correlating logs and related dashboards.
Dashboard Contents
Global and Local Filters
The dashboard provides the following controls:
Periodsets the time range for viewing dataTask Typelimits analysis to the selected operation typeNodeselects a cluster node for detailed analysisTask IDfinds or verifies a specific task by its identifier
Dashboard Metrics
Operational Activity
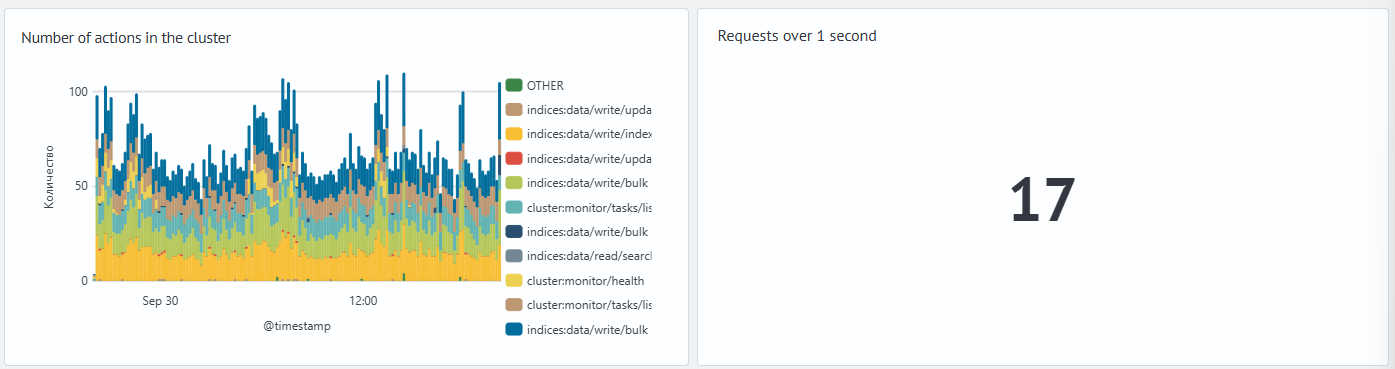
| Panel | What It Shows | When to Review | Normal Operating Guidelines | When Additional Investigation Is Required |
|---|---|---|---|---|
| "Action Count in Cluster" | Distribution of task records by action type. | To determine which operation classes generate most cluster activity. | The distribution matches the known load profile and scheduled operations. | Correlate sustained growth of an individual action with user traffic, shard operations, resources, and delays. Task volume alone does not indicate overload. |
| "Queries Over 1 Second" | Number of tasks that exceed the duration threshold shown in the panel title. | During the initial review of an increase in long-running tasks. | Assess the value based on task type and duration requirements. A nonzero value can be expected for long service operations. | Investigate an increase above the threshold if it affects user operations, persists longer than usual, or coincides with queues and errors. |
Task Details and Relationships
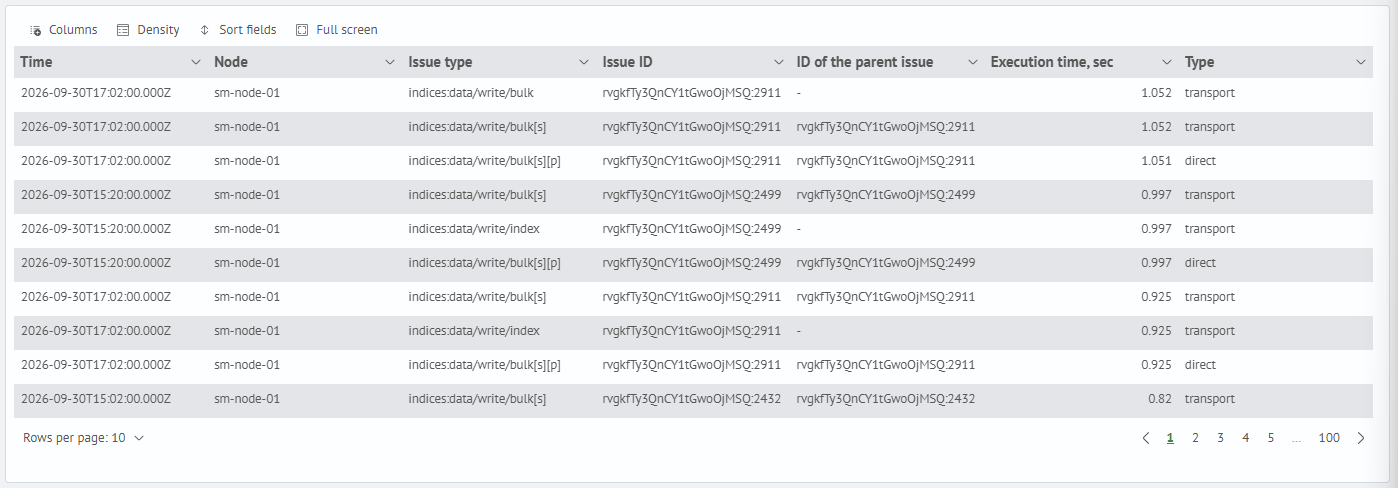
| Panel / Field | What It Shows | When to Review |
|---|---|---|
| Task Detail Table | Task list with technical attributes. | To move from aggregated panels to specific rows. |
| "Execution Time, sec" | Task duration in the dashboard view. | When sorting the table and finding tasks that require further review. |
| "Node" | Node on which the task ran. | To determine whether a delay is distributed across the cluster or concentrated on specific nodes. |
| "Task Type" | Operation type in a table row. | When correlating table rows with the action distribution chart. |
| "Task ID" | Identifier of a specific task. | When correlating rows and distinguishing tasks from repeated records. |
| "Parent Task ID" | Identifier of the parent operation. | When grouping child tasks that belong to one distributed operation. |
Problem Diagnosis Examples
Initial Cluster Activity Assessment
Start with the action distribution and long-running task indicator. This helps determine whether the overall operation profile has changed and whether tasks need review in the table.
A sharp increase in an individual operation type does not by itself indicate an incident. Correlate it with user traffic, scheduled jobs, shard maintenance operations, and node state.
Operation Distribution Analysis
The "Action Count in Cluster" chart shows the operational activity structure. Column height reflects the total number of task records in the selected period, while colored segments show the contribution of individual action types.
The chart does not measure resource utilization or thread-pool queues. If search operations increase, open Query Performance Monitoring and compare operation count and Query phase duration. If the delay is related to document retrieval, review the corresponding Fetch phase panels. If write operations increase, use Indexing Performance Monitoring to compare indexing count with average document indexing time and throttling time. If shard service operations increase, use Cluster Health to review shard states, active shard percentage, and cluster logs for relocation, recovery, or allocation issues.
Long-Running Task Analysis
Use the "Queries Over 1 Second" indicator as a signal to open the detail table. It indicates that tasks with increased duration exist in the selected context but does not explain the cause.
If long-running tasks are concentrated on one node, review Node Resource Monitoring, Node JVM Monitoring, and Query Performance Monitoring for search tasks. Correlate CPU load, read/write volume, queued and rejected tasks, heap usage, and average GC pause time with the relevant period and node.
For write tasks, use Indexing Performance Monitoring to review indexing time, throttling time, and failed indexing operations. For Logstash data, use Logstash Monitoring to compare received, processed, and sent event counters and review the message log.
Parent ID Relationship Analysis
The "Task ID" and "Parent Task ID" fields help restore relationships between tasks. A shared parent ID across several rows means that the tasks belong to one parent operation. To distinguish different child tasks from repeated records for one task, also compare "Task ID" and row time.
Different parent IDs indicate several parent operations. This information alone cannot determine the number of clients, user queries, or independent load sources.
Typical Scenarios
Group of Long-Running Tasks with a Shared Parent ID
This scenario occurs when the long-running task indicator rises and the table contains several rows with the same "Parent Task ID". This may indicate that several child tasks belong to one distributed operation.
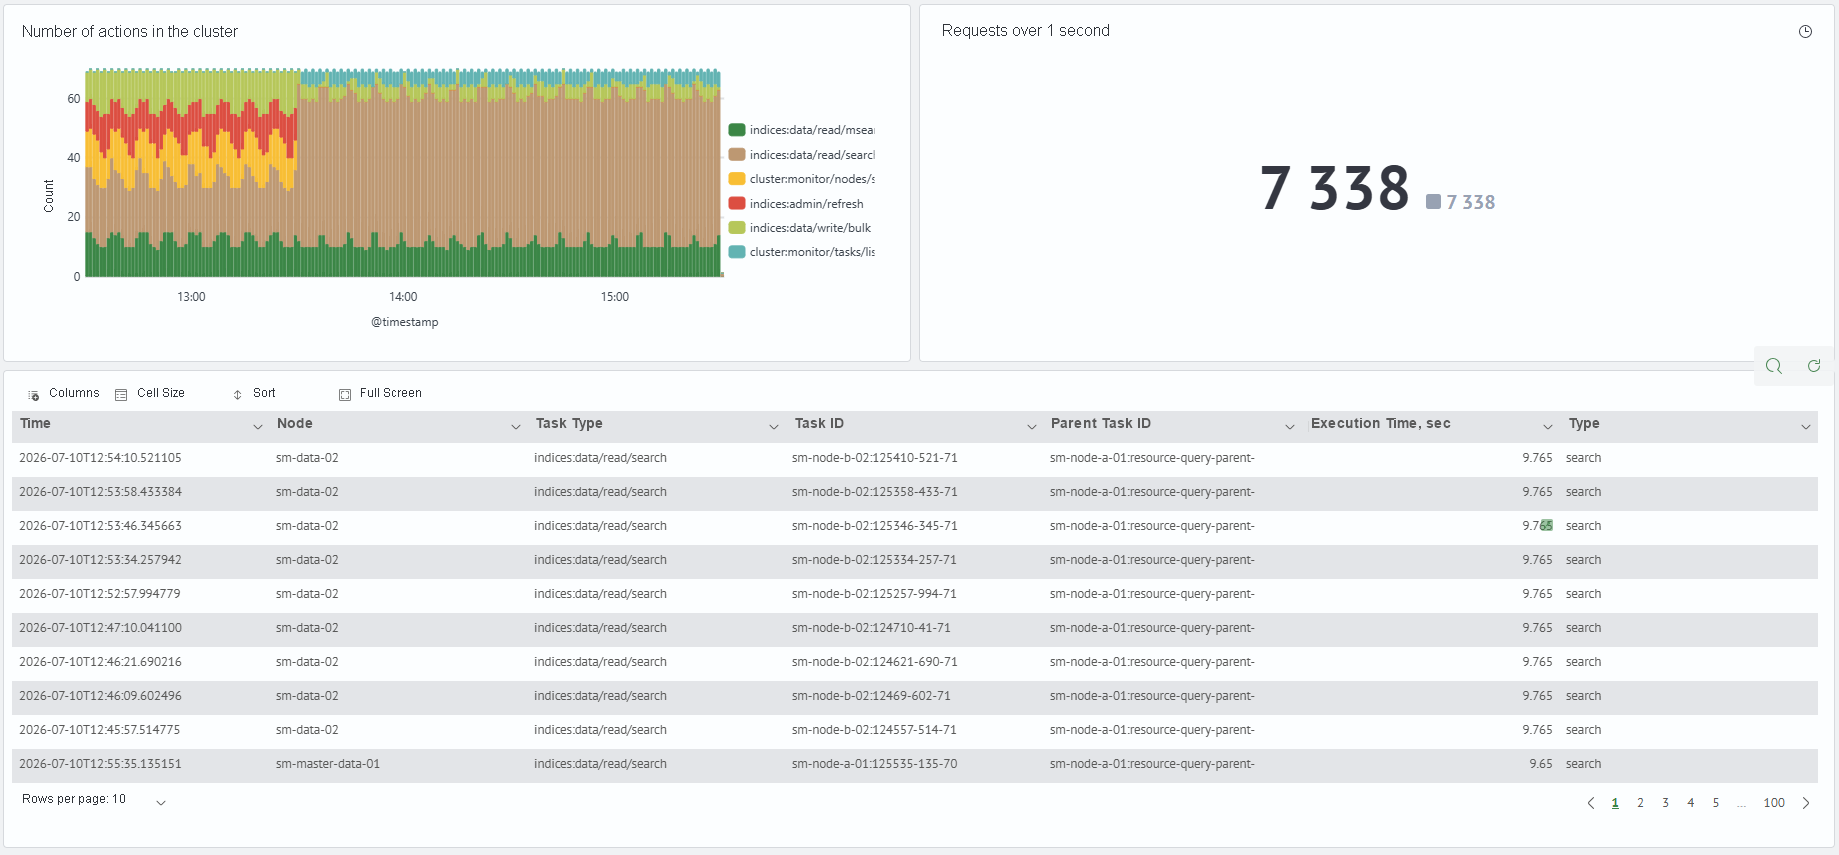
The image shows an example of jointly analyzing three dashboard areas: action distribution, the long-running task indicator, and the detail table. Use this sequence: identify the dominant operation type, find long-running rows, compare nodes, and determine whether tasks share a "Parent Task ID".
Use the following order:
- Review the "Queries Over 1 Second" indicator. Determine whether the metric is increasing and exceeds the expected value
- Review the "Action Count in Cluster" chart. Identify the predominant operation type in the selected period
- Open the detail table. Compare operation type, node, execution time, "Task ID", and "Parent Task ID"
- Group rows by parent ID. If rows share a parent ID, analyze them as one distributed operation. If parent IDs differ, review the overall load profile and node distribution