Heatmap
Overview

Heatmap is a type of data visualization where information is represented as rectangular areas of different colors. Each area corresponds to a different category, and its color represents the quantitative value in that category. A Heatmap is typically used to display quantitative values of different categories in color.
Settings
General
In the General tab, you can set the following parameters:
| Setting | Description | JSON-field |
|---|---|---|
| Show scroll bar | A switch to enable or disable the display of an overview scale of the entire visualization, allowing you to select a specific section of the visualization for detailed viewing. | general.showScrollBar |
| Show vertical scroll bar | A switch to enable or disable the display of an overview scale of the entire visualization vertically, allowing you to select a specific section of the visualization for detailed viewing. | general.showScrollBarY |
| Display margins between elements | Switch to enable or disable indents separating Heatmap elements. | general.enableSpace |
Smart Monitor general settings window:

X-Axis
In the X-Axis tab, you can set the following parameters:
| Setting | Description | JSON-field |
|---|---|---|
| Title | Text field that allows you to specify the name of the X-Axis. | xaxis.title |
| Field | Selection that allows you to choose the data field for the X-Axis. | xaxis.field |
| Label rotation | Selection to set the rotation of the X-Axis name. Useful if the X-axis name is too long. | xaxis.labelRotation |
| Truncate label | A switch that allows you to enable or disable the truncation of the X-Axis name. Useful if the X-Axis name is too long. | xaxis.truncate |
Smart Monitor X-Axis settings window:

Y-Axis
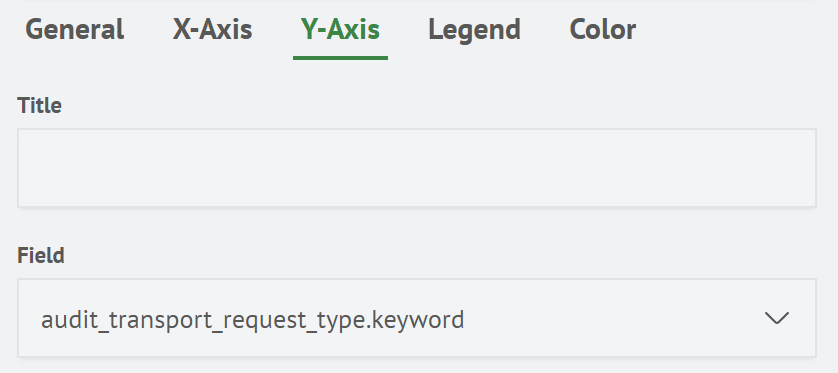
In the Y-Axis tab, you can set the following parameters:
| Setting | Description | JSON-field |
|---|---|---|
| Title | A text field that allows you to specify the name of the Y-Axis. | yaxis.title |
| Field | Selection that allows you to choose the data field for the Y-Axis. | yaxis.field |
Smart Monitor Y-Axis settings window:
Legend
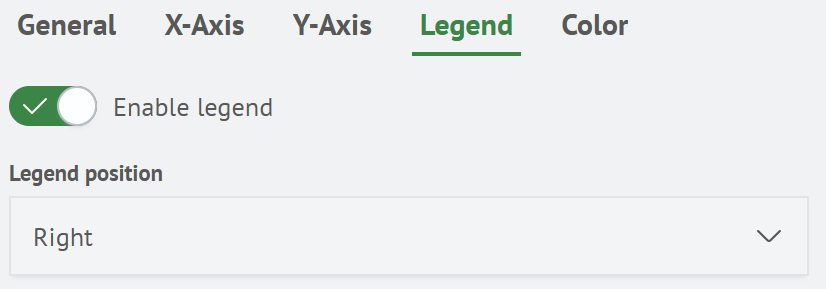
In the Legend tab, you can set the following parameters:
| Setting | Description | JSON-field |
|---|---|---|
| Enable legend | A switch to enable or disable the legend display. | legend.enabled |
| Legend position | A seletion that allows you to specify the location of the legend. Available values: Left, Right, Bottom and Top. | legend.position |
Smart Monitor legend settings window:
Color
In the Color tab, you can set the following parameters:
| Setting | Description | JSON-field |
|---|---|---|
| Field | A selection that allows you to choose the field on which the coloring will take place. | color.field |
| Type | Color method selection. Options for selecting Minimum-Maximum and Intervals are available. | color.type |
When you select a coloring with the Minimum-Maximum type, the following settings will be available:
| Setting | Description | JSON-field |
|---|---|---|
| Minimum color | Color selection for the minimum value. | color.minColor |
| Maximum color | Color selection for the maximum value. | color.maxColor |
If you select a coloring with the Intervals type, you can specify the color by a range of values.
To do this, you need to click the Add value button, then specify the parameters for the series.
| Setting | Description | JSON-field |
|---|---|---|
| Upper limit of the range | Numeric input to specify the upper boundary of the interval. | color.intervals[0].to |
| Color | Color selection. | color.intervals[0].color |
Smart Monitor color Minimum-Maximum settings window:

Smart Monitor color Intervals settings window:

Heatmap creation
Creating a heatmap is possible when used in a query that returns data with categories and with numeric values.
For example, the results of a query that returns data with categories and a numeric value:
source test-am5-charts-heatmap
| table hour, value, weekday
You can display a Heatmap by selecting the appropriate type from the Visualization tab on the search page.

The diagram can then be used immediately on the dashboard by clicking the Add to dashboard button.