Single Value
Overview

Single Value is a type of data visualization that focuses on displaying and emphasizing a single numeric value or metric. This approach to data visualization is particularly effective in situations where a specific metric needs to be presented quickly and clearly. Using a metric allows you to focus on one key indicator, minimizing noise and allowing users to quickly understand key trends or achievements.
One of the benefits of using a metric is its simplicity and clarity. Visualizing a single numeric value is usually done with a simple representation of the number and additional displays such as, a graph of the change in value, a trend, and a trend graph.
Settings Single Value
General
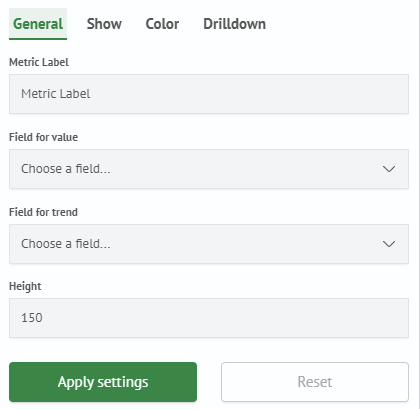
In the General tab, you can set the following parameters:
| Setting | Description | JSON-field |
|---|---|---|
| Metric Label | An optional field that is responsible for the name of the metric - the text that is displayed below the value. Dashboard token values can be substituted. | label |
| Field for value | Mandatory field that is responsible for the displayed metric value (column from the query results). | fieldForValue |
| Field for trend | Optional field responsible for displaying the trend of metric change. | fieldForTrend |
Smart Monitor general settings window:
Show
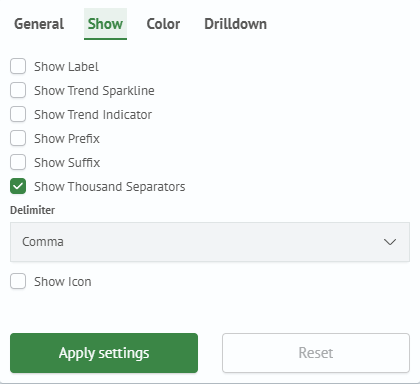
In the Show tab, you can set the following parameters:
| Setting | Description | JSON-field |
|---|---|---|
| Show Label | Checkbox that is responsible for displaying the name of the metric. | show.label |
| Show Trend Sparkline | Checkbox that is responsible for displaying the trend of the metric change. | show.arrow |
| Show Trend Indicator | Checkbox that is responsible for displaying the trend indicator. | show.sparkline |
| Show Thousand Separators | Checkbox that is responsible for displaying the thousandths separator. | show.delimiters |
| Delimiter | Thousandths separator selection. | show.delimiter |
Smart Monitor show settings window:
Color
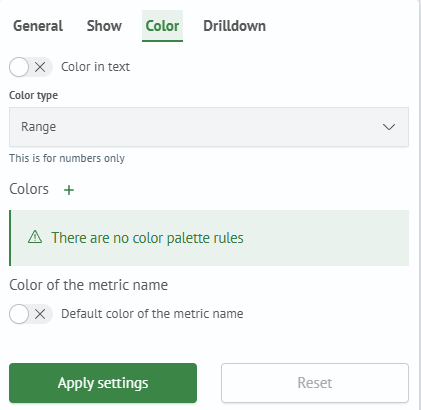
In the Color tab, you can set the following parameters:
| Setting | Description | JSON-field |
|---|---|---|
| Text Color/Background Color | Toggle that controls visualization coloring: colors either the text or the background. | color.invert |
| Color Scheme Type | Selector that controls the metric coloring mode. Available values: Range and By Value. | color.isRange |
| Color Palette | Set of colors to be used in the visualization. The By Value/Range parameter affects its function. In By Value mode, wildcard matching is supported. | color.color[] |
| Default Metric Name Color/Custom Metric Name Color | Toggle that controls metric name coloring: use the metric color or set a custom color. | color.colorLabel.isColorLabel |
| Metric Name Color | Color picker for the metric name. Available only when the Custom Metric Name Color parameter is selected. | color.colorLabel.color |
Smart Monitor color settings window:
Single Value creation
To create this type of visualization, it is worth using a query that returns an aggregation. It can be the number of some values, sum, number of unique values, and so on. SM provides several aggregation commands. For the Single Value type, stats is considered.
The following is an example of a query with this command:
source winlog_auth
| stats count(event.action)
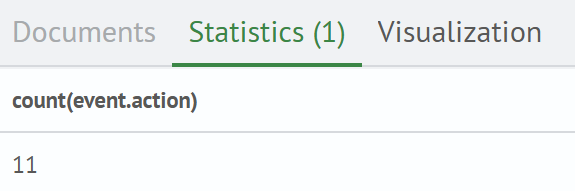
If you go to the Visualization tab. By default (if the query does not use timeaggs and timechart) you will see the Tabular view of the visualization:

In the first dropdown list, you must select Single Value. After changing the parameter, an empty rectangle will be displayed, because no parameters are set. Below you need to specify the mandatory parameter Field for value, from the dropdown list you select the field, for example: count(event.action). The result will be as follows:

Now you can add this visualization to a dashboard by creating it or selecting an existing one. To do this, click the Add to dashboard button.

After that, you need to click the Save button. The visualization has been created and added.