Examples of work
This article provides examples of working with the source code of dashboards. By familiarizing yourself with the JSON source code, the user will be able to further customize the dashboards created.
Basic Dashboard
This example uses a set of simple JSON elements to build a basic dashboard.

Source Code
{
/* Dashboard header */
"label": "Basic dashboard",
"inputs": [],
/* the anels are located inside the lines */
"rows": [
{
  "panels": [
    /* The dashboard consists of only one panel */
    {
      "inputs": [],
      "height": 600,
      "label": "Top 10 user actions (In the last 24 hours)",
      "type": "sm",
      "viz": {
        /* A set of settings for displaying results */
        "options": {
          "colorRuleList": [],
          "tableAutoWidth": true,
          "pagination": {
            "enabled": true,
            "rowsPerPageList": [
              {
                "label": "5"
              },
              {
                "label": "10"
              },
              {
                "label": "25"
              },
              {
                "label": "50"
              }
            ]
          },
          /* Search query */
          "sme": {
            "query": "source winlog_auth\r\n| stats count(event.action) as \"Number of actions\", values(event.action) as \"Actions\" by user.name\r\n| rename user.name as \"User\"\r\n| sort 0 -num('Number of actions')\r\n| head 10"
          },
          "summary": {
            "enabled": false
          },
          "drilldown": {
            "enableDrilldown": false,
            "drilldownType": "search",
            "drilldownText": "",
            "drilldownQuery": "",
            "drilldownCustomTimeTokenEarliest": "now-24h",
            "drilldownCustomTimeTokenLatest": "now",
            "drilldownSelectTimeToken": ""
          },
          "timeToken": ""
        },
        /* Time period of the search query */
        "timeToken": {
          "start": "now-24h",
          "end": "now"
        },
        "type": "table"
      },
      "subpanels": []
    }
  ]
}
],
"vars": []
}
Display search results using panels
The search results can be displayed as a table or a list of events, as well as set different diagrams. For this purpose the viz.type parameter is used in the panel, which defines the diagram type.

Dashboard source code
{
  "label": "Diagrams for visualizing results",
  "inputs": [],
  "rows": [
    {
      "panels": [
        {
          "inputs": [],
          "height": 300,
          "label": "Top User Actions (Pie Chart)",
          "type": "sm",
          "viz": {
            "options": {
              "general": {
                "checkedDonut": false,
                "checkedLabel": false,
                "checkedOther": true,
                "checkedSliceCount": false,
                "checkedSlicePercent": false,
                "textField": "",
                "threshold": 2,
                "truncateText": false,
                "truncatePosition": "right"
              },
              "drilldown": {
                "enableDrilldown": false,
                "drilldownType": "search",
                "drilldownText": "",
                "drilldownQuery": "",
                "drilldownCustomTimeTokenEarliest": "now-24h",
                "drilldownCustomTimeTokenLatest": "now",
                "drilldownSelectTimeToken": ""
              },
              "color": {
                "rulesArray": []
              },
              "theme": {
                "name": "Smart Monitor"
              },
              "sme": {
                "query": "source winlog_auth\r\n| stats count(event.action) as \"Number of actions\", values(event.action) as \"Actions\" by user.name\r\n| rename user.name as \"User\"\r\n| sort 0 -num('Number of actions')\r\n| head 5"
              },
              "timeToken": ""
            },
            "timeToken": {
              "start": "now-24h",
              "end": "now"
            },
            /* Each panel has its own chart type defined */
            "type": "pie"
          },
          "subpanels": []
        },
        {
          "inputs": [],
          "height": 300,
          "label": "Top User actions (Metric)",
          "type": "sm",
          "viz": {
            "options": {
              "general": {
                "fieldForTrend": "Number of actions",
                "fieldForValue": "Number of actions",
                "label": ""
              },
              "color": {
                "invert": true,
                "isRange": true,
                "color": [],
                "range": false
              },
              "show": {
                "arrow": false,
                "label": false,
                "sparkline": true,
                "delimiters": true,
                "delimiter": ","
              },
              "sme": {
                "query": "source winlog_auth\r\n| stats count(event.action) as \"Number of actions\", values(event.action) as \"Actions\" by user.name\r\n| rename user.name as \"User\"\r\n| sort 0 -num('Number of actions')\r\n| head 5"
              },
              "drilldown": {
                "drilldownText": "",
                "drilldownType": "search"
              },
              "timeToken": ""
            },
            "timeToken": {
              "start": "now-24h",
              "end": "now"
            },
            "type": "single"
          },
          "subpanels": []
        },
        {
          "inputs": [],
          "height": 300,
          "label": "Top User actions (Table)",
          "type": "sm",
          "viz": {
            "options": {
              "colorRuleList": [],
              "tableAutoWidth": true,
              "pagination": {
                "enabled": true,
                "rowsPerPageList": [
                  {
                    "label": "5"
                  },
                  {
                    "label": "10"
                  },
                  {
                    "label": "25"
                  },
                  {
                    "label": "50"
                  }
                ]
              },
              "sme": {
                "query": "source winlog_auth\r\n| stats count(event.action) as \"Number of actions\", values(event.action) as \"Actions\" by user.name\r\n| rename user.name as \"User\"\r\n| sort 0 -num('Number of actions')\r\n| head 5"
              },
              "summary": {
                "enabled": false
              },
              "drilldown": {
                "enableDrilldown": false,
                "drilldownType": "search",
                "drilldownText": "",
                "drilldownQuery": "",
                "drilldownCustomTimeTokenEarliest": "now-24h",
                "drilldownCustomTimeTokenLatest": "now",
                "drilldownSelectTimeToken": ""
              },
              "timeToken": ""
            },
            "timeToken": {
              "start": "now-24h",
              "end": "now"
            },
            "type": "table"
          },
          "subpanels": []
        }
      ]
    },
    {
      "panels": [
        {
          "inputs": [],
          "height": 300,
          "label": "Top User Actions (Column Chart)",
          "type": "sm",
          "viz": {
            "options": {
              "general": {
                "showScrollBar": false,
                "stackedMode": false,
                "enableBar": false,
                "multiseries": false
              },
              "grouping": {
                "dataGrouping": true,
                "dataGroupingAutoBaseInterval": true,
                "dataGroupingBaseInterval": {
                  "timeUnit": "day",
                  "count": 1
                },
                "dataGroupingCount": 1000
              },
              "drilldown": {
                "enableDrilldown": false,
                "drilldownType": "search",
                "drilldownText": "",
                "drilldownQuery": "",
                "drilldownCustomTimeTokenEarliest": "now-24h",
                "drilldownCustomTimeTokenLatest": "now",
                "drilldownSelectTimeToken": "",
                "drilldownTokens": []
              },
              "xaxis": {
                "title": "",
                "labelRotation": 0,
                "truncate": false
              },
              "yaxis": {
                "title": "",
                "logarithmic": "false",
                "minVal": "",
                "maxVal": ""
              },
              "legend": {
                "enabled": true,
                "position": "right",
                "truncateText": false
              },
              "color": {
                "colorList": []
              },
              "sme": {
                "query": "source winlog_auth\r\n| stats count(event.action) as \"Number of actions\" by user.name\r\n| rename user.name as \"User\"\r\n| sort 0 -num('Number of actions')\r\n| head 5"
              },
              "timeToken": ""
            },
            "timeToken": {
              "start": "now-24h",
              "end": "now"
            },
            "type": "column"
          },
          "subpanels": []
        },
        {
          "inputs": [],
          "height": 300,
          "label": "Top User Actions (Line Chart)",
          "type": "sm",
          "viz": {
            "options": {
              "general": {
                "showScrollBar": false,
                "stackedMode": false,
                "enableArea": false,
                "multiseries": false
              },
              "grouping": {
                "dataGrouping": true,
                "dataGroupingAutoBaseInterval": true,
                "dataGroupingBaseInterval": {
                  "timeUnit": "day",
                  "count": 1
                },
                "dataGroupingCount": 1000
              },
              "xaxis": {
                "title": "",
                "labelRotation": 0,
                "truncate": false
              },
              "yaxis": {
                "title": "",
                "logarithmic": "false",
                "minVal": "",
                "maxVal": ""
              },
              "legend": {
                "enabled": true,
                "position": "right",
                "truncateText": true
              },
              "color": {
                "colorList": []
              },
              "sme": {
                "query": "source winlog_auth\r\n| stats count(event.action) as \"Number of actions\" by user.name\r\n| rename user.name as \"User\"\r\n| sort 0 -num('Number of actions')\r\n| head 5"
              },
              "drilldown": {
                "enableDrilldown": false,
                "drilldownType": "search",
                "drilldownText": "",
                "drilldownQuery": "",
                "drilldownCustomTimeTokenEarliest": "now-24h",
                "drilldownCustomTimeTokenLatest": "now",
                "drilldownSelectTimeToken": "",
                "drilldownTokens": []
              },
              "timeToken": ""
            },
            "timeToken": {
              "start": "now-24h",
              "end": "now"
            },
            "type": "line"
          },
          "subpanels": []
        }
      ]
    }
  ],
  "vars": []
}
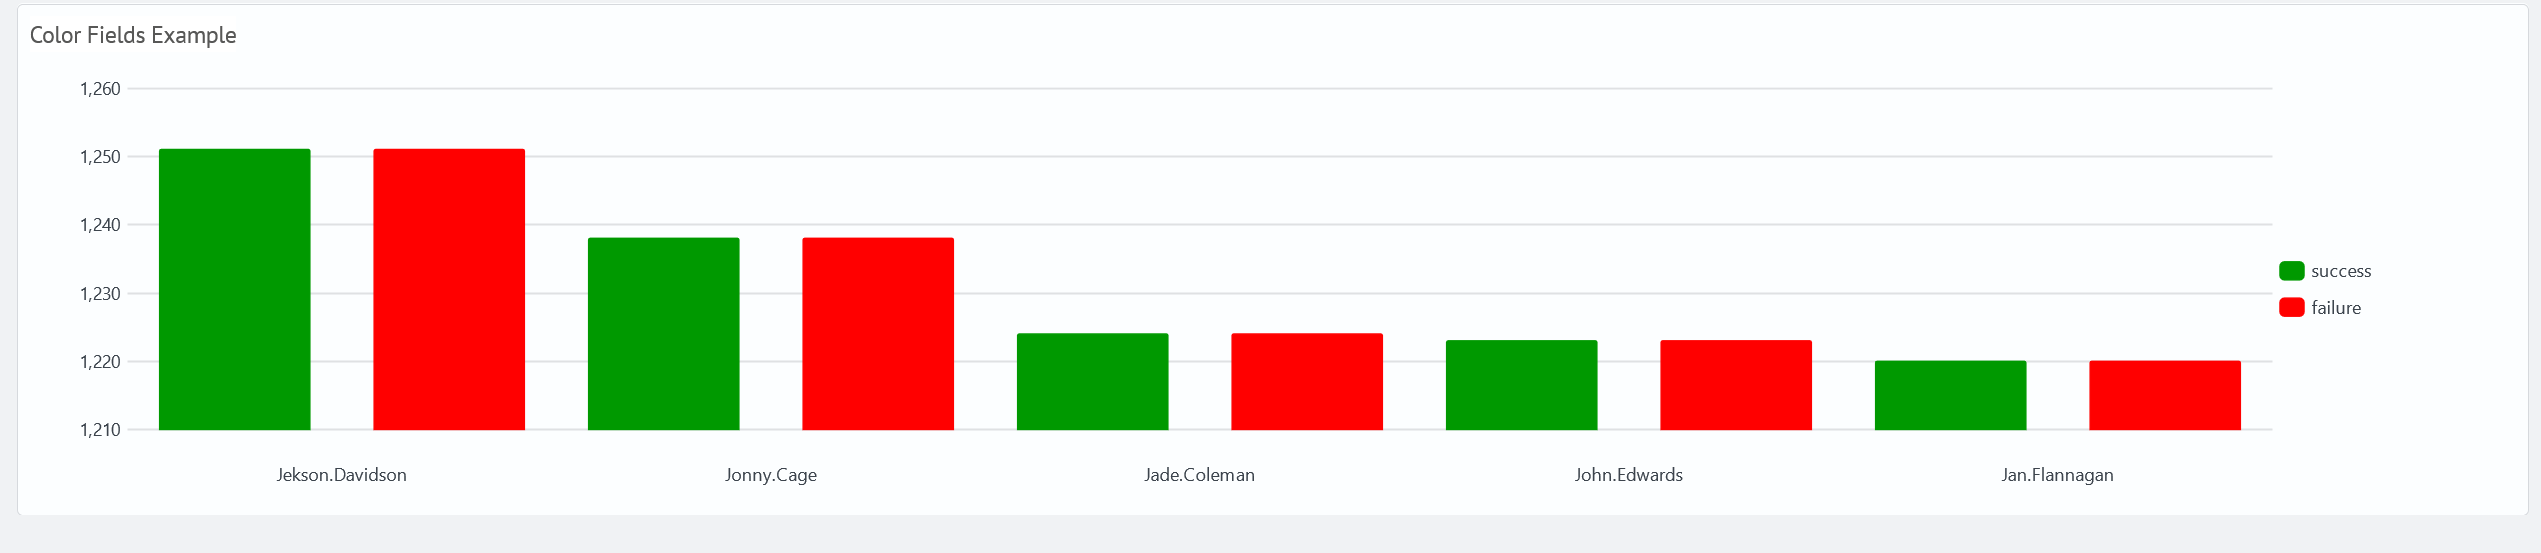
Setting custom colors for fields in diagrams
The viz.options.color property is used to customize the colors of fields in a diagram. The selected colors will be applied each time this diagram is drawn, regardless of other diagrams or color settings on the dashboard.
Example
The following example demonstrates the color settings for a chart that displays the number of user events for each type of event outcome (event.outcome). The following search query is used in this example.
source winlog_auth
| search user.name!="*$"
| aggs count(event.action) as event.action.count,
        values(event.outcome) as event.outcome by user.name
| chart values(event.action.count) as event.outcome.count over user.name by event.outcome
| fillnull value=0 *
| eval success = tonumber(success)
| eval failure = tonumber(failure)
| table user.name, success, failure
| sort 0 -failure
| head 5
Without setting the viz.options.color.color.colorList property, the visualization uses a predefined mapping of field colors based on the order of the returned values. In this case, the color dark green is used for the success value and green for failure.

To change the mapping of field colors, you must append colorList to the JSON dashboard source code. For example, the following configuration defines the specified colors for each type of outcome.
- success:
green - failure:
red
{
  "viz": {
    "options": {
      "color": {
        "colorList": [
          {
            "field": "success",
            "color": "#009900"
          },
          {
            "field": "failure",
            "color": "#FF0000"
          },
          {
            "field": "unknown",
            "color": "#C4C4C0"
          }
        ]
      }
    }
  }
}
After configuring the color scheme, the dashboard looks like this.
Source Code
{
  "label": "Visualization Color",
  "inputs": [],
  "rows": [
    {
      "panels": [
        {
          "inputs": [],
          "height": 300,
          "label": "Color Fields Example",
          "type": "sm",
          "viz": {
            "options": {
              "general": {
                "showScrollBar": false,
                "stackedMode": false,
                "enableBar": false,
                "multiseries": false
              },
              "grouping": {
                "dataGrouping": true,
                "dataGroupingAutoBaseInterval": true,
                "dataGroupingBaseInterval": {
                  "timeUnit": "day",
                  "count": 1
                },
                "dataGroupingCount": 1000
              },
              "drilldown": {
                "enableDrilldown": false,
                "drilldownType": "search",
                "drilldownText": "",
                "drilldownQuery": "",
                "drilldownCustomTimeTokenEarliest": "now-24h",
                "drilldownCustomTimeTokenLatest": "now",
                "drilldownSelectTimeToken": "",
                "drilldownTokens": []
              },
              "xaxis": {
                "title": "",
                "labelRotation": 0,
                "truncate": false
              },
              "yaxis": {
                "title": "",
                "logarithmic": "false",
                "minVal": "",
                "maxVal": ""
              },
              "legend": {
                "enabled": true,
                "position": "right",
                "truncateText": false
              },
              "color": {
                "colorList": [
                  {
                    "field": "success",
                    "color": "#009900"
                  },
                  {
                    "field": "failure",
                    "color": "#FF0000"
                  },
                  {
                    "field": "unknown",
                    "color": "#C4C4C0"
                  }
                ]
              },
              "sme": {
                "query": "source winlog_auth\r\n| search user.name!=\"*$\"\r\n| aggs count(event.action) as event.action.count, \r\n        values(event.outcome) as event.outcome by user.name\r\n| chart values(event.action.count) as event.outcome.count over user.name by event.outcome\r\n| fillnull value=0 *\r\n| eval success = tonumber(success)\r\n| eval failure = tonumber(failure)\r\n| table user.name, success, failure\r\n| sort 0 -failure\r\n| head 5"
              },
              "timeToken": ""
            },
            "timeToken": {
              "start": "now-24h",
              "end": "now"
            },
            "type": "column"
          },
          "subpanels": []
        }
      ]
    }
  ],
  "vars": []
}